HOT TOPICS LIST
- MACD
- Fibonacci
- RSI
- Gann
- ADXR
- Stochastics
- Volume
- Triangles
- Futures
- Cycles
- Volatility
- ZIGZAG
- MESA
- Retracement
- Aroon
INDICATORS LIST
LIST OF TOPICS
PRINT THIS ARTICLE
by Chaitali Mohile
The previous high resistance and bearish formation is an upcoming danger for the FTSE rally.
Position: Sell
Chaitali Mohile
Active trader in the Indian stock markets since 2003 and a full-time writer. Trading is largely based upon technical analysis.
PRINT THIS ARTICLE
TECHNICAL ANALYSIS
$FTSE Ready To Shed Few Points
10/29/10 12:23:22 PMby Chaitali Mohile
The previous high resistance and bearish formation is an upcoming danger for the FTSE rally.
Position: Sell
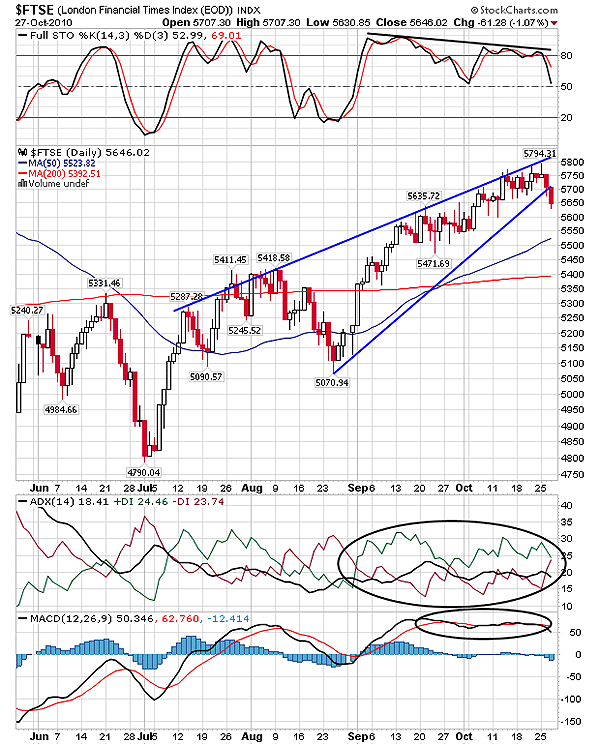
| The footsie ($FTSE) has formed a rising wedge formation on the daily time frame in Figure 1. The formation is about three months old and thus is considered a short-term pattern. The rising wedge is a bearish reversal formation that breaks downward, initiating a fresh bearish rally. The negative divergence of full stochastic (14,3,3) confirms the bearish breakout of the rising wedge formation. The moving average convergence/divergence (MACD) (12,26,9) has turned highly volatile and is likely to undergo a bearish crossover in positive territory. The selling pressure (red line) of the average directional index (ADX) (14) has surged and is ready to initiate a fresh downtrend. Thus, the bearish breakout of the pattern is confirmed by the indicators in Figure 1. We can see the two trendlines of the wedge has converged and the index has breached the lower trendline support. October 28's opening below that of the previous day's close would confirm the bearish breakout. |

|
| FIGURE 1: $FTSE, DAILY. The rising wedge pattern has broken downward, initiating the fresh bearish rally. |
| Graphic provided by: StockCharts.com. |
| |
| While climbing upward, $FTSE has converted the 50-day and the 200-day moving average (MA) resistance to support. Therefore, the new declining rally has the support of these two MAs at the 5500 and 5400 levels. This shows that $FTSE is likely to lose about 300 points from current levels. |

|
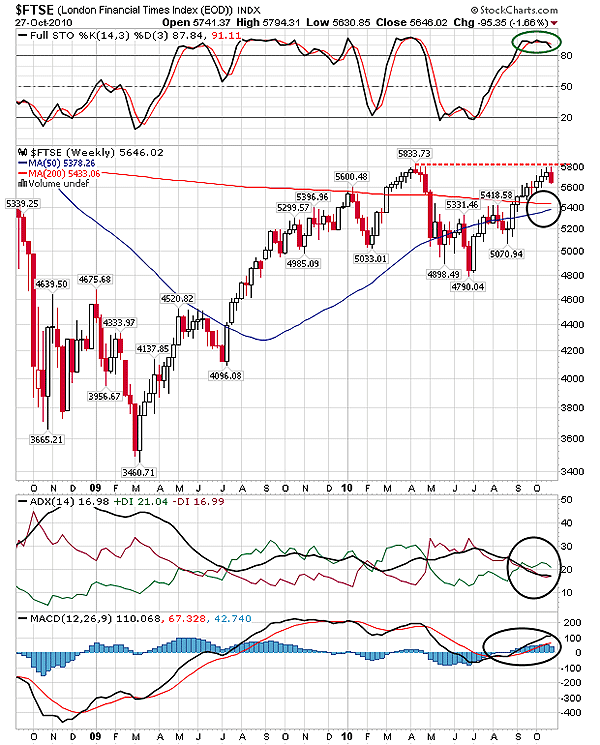
| FIGURE 2: $FTSE, WEEKLY. The converging 50-day and the 200-day MAs are likely to undergo the bullish crossover, which would extend positive support for the future bearish rally. |
| Graphic provided by: StockCharts.com. |
| |
| In early 2010, $FTSE violated the 200-day MA resistance and made a new high at 5833 levels. However, an oversold stochastic, unstable uptrend, and the shaky MACD (12,26,9) all suggested that the news may not sustain. Sure enough, the $FTSE plunged below its MA supports, losing more than 1,000 points. The relief rally from the lower levels has reached the previous high resistance at 5833 levels and has formed a double-top formation -- a bearish trend reversal. Although the valley between the two peaks is not in the shape of a perfect V-formation, the diminishing strength and weak uptrend would restrict the bullish rally. As a result, $FTSE would plunge to the 50-day and the 200-day MA supports at the 5400 levels. |
| Thus, the bearish rally is under way for $FTSE. Since the MA supports on both Figures 1 and 2 are at same levels (5500/5400), a strong bullish force exists at these levels. |
Active trader in the Indian stock markets since 2003 and a full-time writer. Trading is largely based upon technical analysis.
| Company: | Independent |
| Address: | C1/3 Parth Indraprasth Towers. Vastrapur |
| Ahmedabad, Guj 380015 | |
| E-mail address: | chaitalimohile@yahoo.co.in |
Traders' Resource Links | |
| Independent has not added any product or service information to TRADERS' RESOURCE. | |
Click here for more information about our publications!
Comments

Request Information From Our Sponsors
- StockCharts.com, Inc.
- Candle Patterns
- Candlestick Charting Explained
- Intermarket Technical Analysis
- John Murphy on Chart Analysis
- John Murphy's Chart Pattern Recognition
- John Murphy's Market Message
- MurphyExplainsMarketAnalysis-Intermarket Analysis
- MurphyExplainsMarketAnalysis-Visual Analysis
- StockCharts.com
- Technical Analysis of the Financial Markets
- The Visual Investor
- VectorVest, Inc.
- Executive Premier Workshop
- One-Day Options Course
- OptionsPro
- Retirement Income Workshop
- Sure-Fire Trading Systems (VectorVest, Inc.)
- Trading as a Business Workshop
- VectorVest 7 EOD
- VectorVest 7 RealTime/IntraDay
- VectorVest AutoTester
- VectorVest Educational Services
- VectorVest OnLine
- VectorVest Options Analyzer
- VectorVest ProGraphics v6.0
- VectorVest ProTrader 7
- VectorVest RealTime Derby Tool
- VectorVest Simulator
- VectorVest Variator
- VectorVest Watchdog
