HOT TOPICS LIST
- MACD
- Fibonacci
- RSI
- Gann
- ADXR
- Stochastics
- Volume
- Triangles
- Futures
- Cycles
- Volatility
- ZIGZAG
- MESA
- Retracement
- Aroon
INDICATORS LIST
LIST OF TOPICS
PRINT THIS ARTICLE
by Donald W. Pendergast, Jr.
There are dozens of companies that claim to have the best indicators and trading tools. Most fail to deliver. Here's a look at a set of discretionary trading tools that actually delivers what is promised.
Position: N/A
Donald W. Pendergast, Jr.
Donald W. Pendergast is a financial markets consultant who offers specialized services to stock brokers and high net worth individuals who seek a better bottom line for their portfolios.
PRINT THIS ARTICLE
CHART ANALYSIS
Are Discretionary Trading Tools Worth The Money?
10/28/10 09:54:15 AMby Donald W. Pendergast, Jr.
There are dozens of companies that claim to have the best indicators and trading tools. Most fail to deliver. Here's a look at a set of discretionary trading tools that actually delivers what is promised.
Position: N/A
| I purchased Roy Kelly's TrendPro indicators for TradeStation v. 8.7 earlier this year, and after a bit of tweaking, I have found them to be well worth the money. Here's a look at a simple trend-following trading template that you can construct with just a handful of Roy Kelly's indicators. |

|
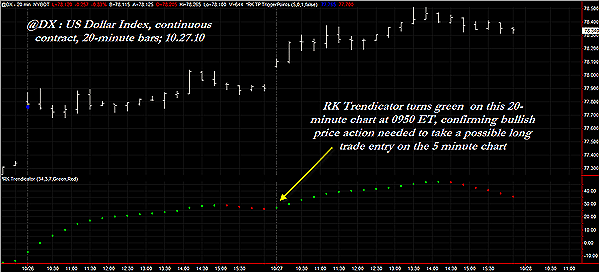
| FIGURE 1: US DOLLAR INDEX, 20-MINUTE. Who says trading has to be complicated? Trading with the trend on a 20-minute chart is one of the best ways to filter your trade entries on a five-minute chart. The RK Trendicator does a good job of keeping traders abreast of the dominant trend in any time frame. |
| Graphic provided by: TradeStation. |
| Graphic provided by: Roy Kelly TrendPro Trendicator. |
| |
| A popular (and surprisingly effective) technique used by discretionary traders is to only take a trade when a strong trend is in effect in a higher time frame chart. For example, if you wanted to short the US Dollar Index on a five-minute chart, you would want to see a strong trend on the 20-minute chart of the same index. You could use the average directional movement index (ADX), moving average convergence/divergence (MACD), or relative strength index (RSI) in a variety of ways on the 20-minute chart to verify the existence of a powerful trend that could be profitably exploited on the smaller time frame. In Figure 1, I've used the Roy Kelly Trendicator to help determine the direction of trend on a 20-minute chart of the US Dollar Index. This indicator is very steady and does a fine job of identifying tradable trend moves. On the morning of October 27, the Trendicator went into green (bullish) mode at the close of the first complete 20-minute bar (0950 ET) of the regular day session for the dollar index, so the next course of action would be to drill down to the five-minute chart to see if two other indicators were flashing a buy signal. Let's look at that chart now. |

|
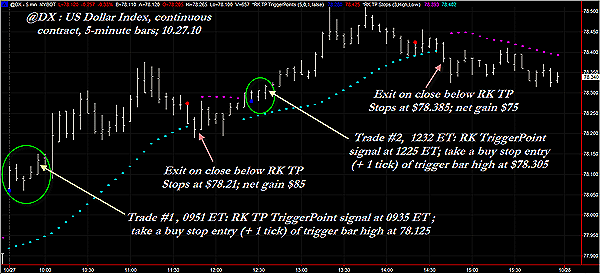
| FIGURE 2: US DOLLAR INDEX, FIVE-MINUTE. Since we know that the dominant trend on the 20-minute chart is bullish, wise traders would want to focus only on long trade entries. Here on the five-minute chart we find two valid long setups, signaled by the blue RK TP TriggerPoints indicator. The string of aqua dots beneath the price bars is the RK TP Stops indicator. This system is completely objective and the indicator settings can be fine-tuned to suit a user's preferences. |
| Graphic provided by: TradeStation. |
| Graphic provided by: Roy Kelly TrendPro indicators, various. |
| |
| On Figure 2, the five-minute chart we find the blue Roy Kelly TP Trigger Points long entry indicator alerting us to a buy signal. The TP buy signal occurred at 0935 ET, so the best course of action might have been to wait for the Trendicator to go green at 0950 ET and then enter a long position once Trendicator confirmation was given and the high price of the TP signal bar was exceeded by one tick -- an entry price of $78.125. With a long position in the market, what now? How do we know where and when to exit the trade at a profit or loss? This question is easily handled by using the Roy Kelly TP Stops indicator (the string of aqua dots beneath the price bars); this is a combination initial stop/trailing stop tool that will help keep a trader in a position with a minimum of head scratching and confusion. This indicator looks similar to the J. Welles Wilder ParaSar indicator but is calculated differently. In my own trading, I've discovered that the RK TP Stops will normally keep you in a winning trade far longer before the final stopout than the ParaSar indicator will. If you're a die-hard trend-follower, you will likely come to the same conclusion in your own trading once you start using it. So with a long entry at $78.125, the RK TP Stops suggested an initial stop about a tick below $77.935. A wise trader would simply keep adjusting the stop higher as needed until the final stopout; in this case, the final stop occurred when the dollar index closed below the RK TP Stops at $78.21 (1145 ET), giving our hypothetical trader a gain of $85 per contract before commissions and slippage. The next long entry came at $78.31 (1232 ET), again relying on the RK TP TriggerPoints blue entry signal and Trendicator green trend confirmation on the 20-minute chart. This time, the trade setup netted $75 per contract before commissions and slippage. The stopout for this trade happened at 1440 ET. While these don't seem to be big-deal trade results, remember that the intraday margin to trade the DX is only about $1,800. If you had a $25,000 account, you might have been able to trade two or even three of these contracts without even breaking a sweat. The only drawback to trading on a semidiscretionary system like this (this is not necessarily how Roy Kelly or anyone else actually trades with these particular indicators, by the way) is the lack of backtesting capability, as delivered. However, for those who have strong TradeStation programming abilities, Roy Kelly does offer additional tools that will allow traders to make various TrendPro indicators into TradeStation functions that can be fully back- and forward-tested; in fact, you can created complete trading systems with this added capability. From what I've seen, the Roy Kelly TrendPro indicators are in the top 99% of all the add-on products available for TradeStation users. Skilled traders should be easily able to recoup their initial investment in a minimum of time, even when using a simple trading template as shown above, depending on the market and time frame being traded. Be sure you do plenty of walkforward or paper trading before actually putting real money on the line with this or any other kind of trading system. |
Donald W. Pendergast is a financial markets consultant who offers specialized services to stock brokers and high net worth individuals who seek a better bottom line for their portfolios.
| Title: | Writer, market consultant |
| Company: | Linear Trading Systems LLC |
| Jacksonville, FL 32217 | |
| Phone # for sales: | 904-239-9564 |
| E-mail address: | lineartradingsys@gmail.com |
Traders' Resource Links | |
| Linear Trading Systems LLC has not added any product or service information to TRADERS' RESOURCE. | |
Click here for more information about our publications!
Comments
Date: 11/02/10Rank: 5Comment:

Request Information From Our Sponsors
- StockCharts.com, Inc.
- Candle Patterns
- Candlestick Charting Explained
- Intermarket Technical Analysis
- John Murphy on Chart Analysis
- John Murphy's Chart Pattern Recognition
- John Murphy's Market Message
- MurphyExplainsMarketAnalysis-Intermarket Analysis
- MurphyExplainsMarketAnalysis-Visual Analysis
- StockCharts.com
- Technical Analysis of the Financial Markets
- The Visual Investor
- VectorVest, Inc.
- Executive Premier Workshop
- One-Day Options Course
- OptionsPro
- Retirement Income Workshop
- Sure-Fire Trading Systems (VectorVest, Inc.)
- Trading as a Business Workshop
- VectorVest 7 EOD
- VectorVest 7 RealTime/IntraDay
- VectorVest AutoTester
- VectorVest Educational Services
- VectorVest OnLine
- VectorVest Options Analyzer
- VectorVest ProGraphics v6.0
- VectorVest ProTrader 7
- VectorVest RealTime Derby Tool
- VectorVest Simulator
- VectorVest Variator
- VectorVest Watchdog
