HOT TOPICS LIST
- MACD
- Fibonacci
- RSI
- Gann
- ADXR
- Stochastics
- Volume
- Triangles
- Futures
- Cycles
- Volatility
- ZIGZAG
- MESA
- Retracement
- Aroon
INDICATORS LIST
LIST OF TOPICS
PRINT THIS ARTICLE
by Chaitali Mohile
The indicators on the US Dollar Index charts are extremely bearish. Will the index initiate a fresh bullish rally or consolidate?
Position: N/A
Chaitali Mohile
Active trader in the Indian stock markets since 2003 and a full-time writer. Trading is largely based upon technical analysis.
PRINT THIS ARTICLE
CHART ANALYSIS
Oversold US Dollar Index
10/28/10 02:15:38 PMby Chaitali Mohile
The indicators on the US Dollar Index charts are extremely bearish. Will the index initiate a fresh bullish rally or consolidate?
Position: N/A
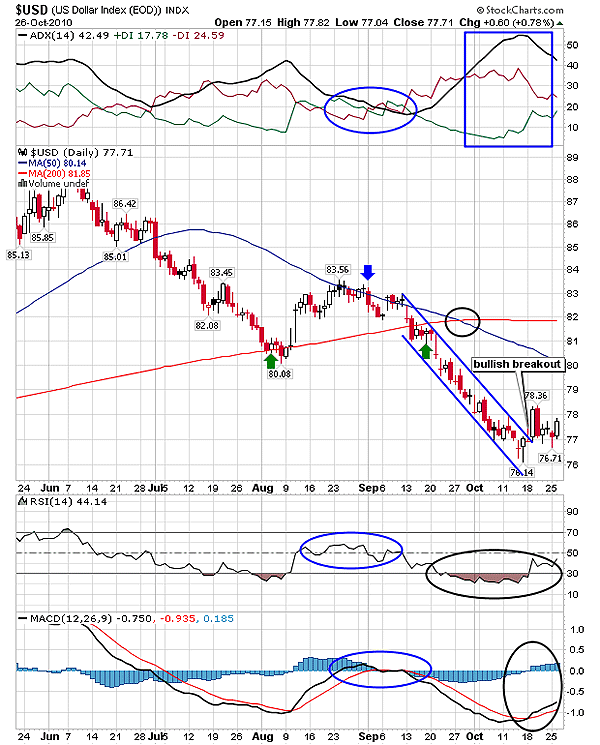
| In August 2010, the US Dollar Index ($USD) was trapped between the 200-day moving average (MA) support and the 50-day MA resistance. Later, the rally was terminated by the short-term MA (50-day) resistance, resuming the prior descending move. The dollar index plunged harder under the resistance of both MAs. The bearish moving average crossover in Figure 1 (see the black circle in price chart) poured additional bearish strength in the descending rally, developing a robust downtrend for the index. Earlier, the index was already in an intermediate downtrend. However, the dollar index failed to enter a new uptrend as the price faced MA resistance. The average directional index (ADX) (14) in Figure 1 shows that the downtrend weakened but the positive directional index (+DI) and negative directional index (-DI) converged, and as a result, suggesting that the fresh uptrend could not develop. |

|
| FIGURE 1: $USD, DAILY |
| Graphic provided by: StockCharts.com. |
| |
| After undergoing the bearish MA breakout in mid-September, the ADX (14) surged above 20 levels with huge selling pressure and the relative strength index (RSI) (14) plunged into its bearish zone below 50 levels. In addition, moving average convergence/divergence (MACD) (12,26,9) showed a bearish crossover by hitting the center line resistance. Thus, the downside rally was filled with bearish momentum. Gradually, the index retraced to the lower level in a steep descending channel. Meantime, the healthy bearish indicators turned extremely bearish, indicating a relief rally in the near future. We can see the ADX (14) has moved above 50 levels, the RSI (14) slipped below 30 levels (an oversold region), and the MACD (12,26,9) plunged deep into negative territory. As these highly bearish oscillators showed readiness to surge out of these extreme levels, the price rally moved upward. |
| However, traders should be watchful for the breakout bullish rally. Currently, though, the indicators are reversing from the bearish zone; they are not suggesting any trend reversal rally. The US Dollar Index is moving sideways in the 78 and 77 range. The index would initiate a confirmed bullish breakout above 79 levels. The bullish movement of indicators in Figure 1 would add strength in the bullish rally in the future. |

|
| FIGURE 2: $USD, WEEKLY |
| Graphic provided by: StockCharts.com. |
| |
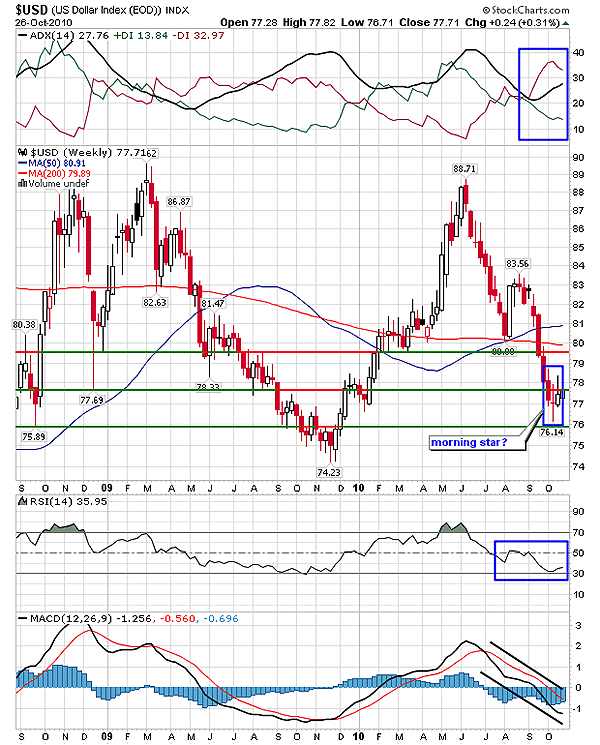
| On the weekly chart in Figure 2, we can see resistance at various levels developed by the previous price rally. The three support/resistance lines show consecutive resistance for the current sideways price action. The ADX (14) shows a developing downtrend, the RSI (14) is in no man's land, and the negative MACD (12,26,9) has plunged into negative territory. Although the three marked candles in Figure 2 reflects a morning star candlestick pattern--a bullish reversal formation--the three resistance lines would suppress any relief rally. |
| In such circumstances, the dollar index is likely to consolidate in the wide range of 75 and 78 in the medium term. The range-bound rally would face high volatility due to resistance along its path. |
Active trader in the Indian stock markets since 2003 and a full-time writer. Trading is largely based upon technical analysis.
| Company: | Independent |
| Address: | C1/3 Parth Indraprasth Towers. Vastrapur |
| Ahmedabad, Guj 380015 | |
| E-mail address: | chaitalimohile@yahoo.co.in |
Traders' Resource Links | |
| Independent has not added any product or service information to TRADERS' RESOURCE. | |
Click here for more information about our publications!
Comments
Date: 11/02/10Rank: 3Comment:

Request Information From Our Sponsors
- StockCharts.com, Inc.
- Candle Patterns
- Candlestick Charting Explained
- Intermarket Technical Analysis
- John Murphy on Chart Analysis
- John Murphy's Chart Pattern Recognition
- John Murphy's Market Message
- MurphyExplainsMarketAnalysis-Intermarket Analysis
- MurphyExplainsMarketAnalysis-Visual Analysis
- StockCharts.com
- Technical Analysis of the Financial Markets
- The Visual Investor
- VectorVest, Inc.
- Executive Premier Workshop
- One-Day Options Course
- OptionsPro
- Retirement Income Workshop
- Sure-Fire Trading Systems (VectorVest, Inc.)
- Trading as a Business Workshop
- VectorVest 7 EOD
- VectorVest 7 RealTime/IntraDay
- VectorVest AutoTester
- VectorVest Educational Services
- VectorVest OnLine
- VectorVest Options Analyzer
- VectorVest ProGraphics v6.0
- VectorVest ProTrader 7
- VectorVest RealTime Derby Tool
- VectorVest Simulator
- VectorVest Variator
- VectorVest Watchdog
