HOT TOPICS LIST
- MACD
- Fibonacci
- RSI
- Gann
- ADXR
- Stochastics
- Volume
- Triangles
- Futures
- Cycles
- Volatility
- ZIGZAG
- MESA
- Retracement
- Aroon
INDICATORS LIST
LIST OF TOPICS
PRINT THIS ARTICLE
by Chaitali Mohile
The bullish breakout of MCHP formed higher bottoms and peaks. The stock is likely to be heading upward.
Position: N/A
Chaitali Mohile
Active trader in the Indian stock markets since 2003 and a full-time writer. Trading is largely based upon technical analysis.
PRINT THIS ARTICLE
CHANNEL LINES
Microchip Technology In Ascending Channel
10/26/10 10:38:45 AMby Chaitali Mohile
The bullish breakout of MCHP formed higher bottoms and peaks. The stock is likely to be heading upward.
Position: N/A
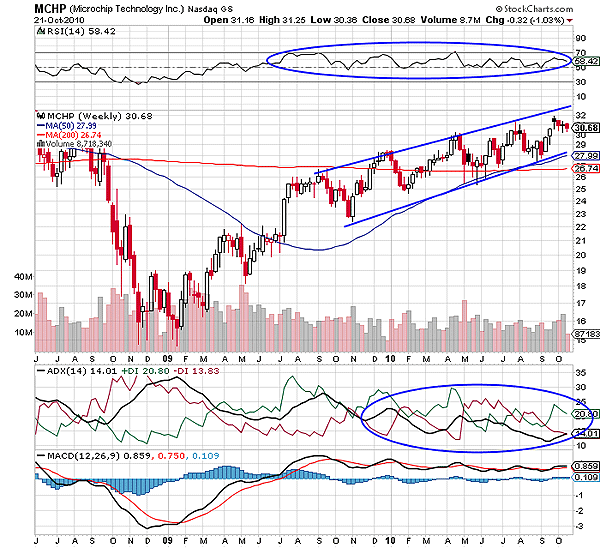
| An ascending channel is a bullish pattern formed by the steady upward price action. The higher highs and higher lows form the channel. Microchip Technology (MCHP) in Figure 1 faced huge volatility while breaching the 200-day moving average (MA) resistance. The stock frequently changed its direction in an ascending range, forming the series of higher highs and lows. The relief rally was initiated in early 2009, but the price action of MCHP gained strength after converting the 50-day moving average (MA) resistance to support. Eventually, the relative strength index (RSI) (14) rushed in a bullish area above 50 levels; the average directional index (ADX) (14) developed a fresh uptrend in Figure 1. In addition, the moving average convergence/divergence (MACD) (12,26,9) surged in positive territory. |

|
| FIGURE 1: MCHP, WEEKLY |
| Graphic provided by: StockCharts.com. |
| |
| As the stock approached the 200-day MA resistance, the price turned shaky and formed higher tops and bottoms. After the MA breakout, MCHP retraced to build new higher bottoms. By drawing two trendlines connecting the tops and bottoms, we can see the ascending channel being formed in Figure 1. The stock has been moving within the channel for about a year and is likely to continue its journey. The RSI (14) indicated consistent bullish strength in the stock and the MACD (12,26,9) was volatile in positive territory, and thus, the price would surge, challenging both the trendlines. The weak ADX (14) confirmed the volatility in the price rally. |
| Another reason for the stable rally in the channel is that MCHP has the support of the lower trendline, the 50-day as well as the 200-day MA. The indicators are not showing any indications for the bullish breakout of the ascending channel; however, the weak trend can damage the trader's interest in the stock. The stock is likely to retrace toward the lower trendline support in the next few weeks. |

|
| FIGURE 2: MCHP, DAILY |
| Graphic provided by: StockCharts.com. |
| |
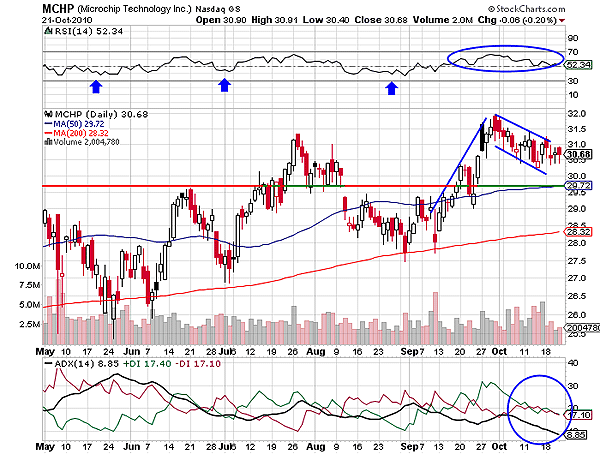
| MCHP has formed a bullish flag & pennant formation on the daily chart in Figure 2. Though the pattern is a bullish continuation, the consolidation format (flag) shows the stability of the pattern. In Figure 2, the flag of the pattern is descending and is filled with large bearish candles as well as the doji. Thus, the consolidation is engulfed with high volatility. The RSI (14) has the support of 50 levels, but the history shows the possibility of breaching the center line support. The ADX (14) is also weak; therefore, the stock would hit the support line formed by the previous highs. The support-resistance line in Figure 1 shows strong support at 29.72 levels generated by the earlier high pivots, a gap down, and the upper and the lower shadows of the candles of the previous rally. Since the 50-day MA and the support line are intercepting at 29.7, additional strength at this level extends the support to the descending rally. |
| Depending on the direction that the flag & pennant formation breaks, MCHP would continue its bullish path within the channel in the medium term. All the major supports would prevent the damage. |
Active trader in the Indian stock markets since 2003 and a full-time writer. Trading is largely based upon technical analysis.
| Company: | Independent |
| Address: | C1/3 Parth Indraprasth Towers. Vastrapur |
| Ahmedabad, Guj 380015 | |
| E-mail address: | chaitalimohile@yahoo.co.in |
Traders' Resource Links | |
| Independent has not added any product or service information to TRADERS' RESOURCE. | |
Click here for more information about our publications!
PRINT THIS ARTICLE

Request Information From Our Sponsors
- StockCharts.com, Inc.
- Candle Patterns
- Candlestick Charting Explained
- Intermarket Technical Analysis
- John Murphy on Chart Analysis
- John Murphy's Chart Pattern Recognition
- John Murphy's Market Message
- MurphyExplainsMarketAnalysis-Intermarket Analysis
- MurphyExplainsMarketAnalysis-Visual Analysis
- StockCharts.com
- Technical Analysis of the Financial Markets
- The Visual Investor
- VectorVest, Inc.
- Executive Premier Workshop
- One-Day Options Course
- OptionsPro
- Retirement Income Workshop
- Sure-Fire Trading Systems (VectorVest, Inc.)
- Trading as a Business Workshop
- VectorVest 7 EOD
- VectorVest 7 RealTime/IntraDay
- VectorVest AutoTester
- VectorVest Educational Services
- VectorVest OnLine
- VectorVest Options Analyzer
- VectorVest ProGraphics v6.0
- VectorVest ProTrader 7
- VectorVest RealTime Derby Tool
- VectorVest Simulator
- VectorVest Variator
- VectorVest Watchdog
