HOT TOPICS LIST
- MACD
- Fibonacci
- RSI
- Gann
- ADXR
- Stochastics
- Volume
- Triangles
- Futures
- Cycles
- Volatility
- ZIGZAG
- MESA
- Retracement
- Aroon
INDICATORS LIST
LIST OF TOPICS
PRINT THIS ARTICLE
by Billy Williams
Chasing every opportunity in the market only leads to losses. Sometimes, the best trading tool a pro can use is simply being selective.
Position: Buy
Billy Williams
Billy Williams has been trading the markets for 27 years, specializing in momentum trading with stocks and options.
PRINT THIS ARTICLE
STRATEGIES
Selective Opportunity Is A Trader's Weapon
10/26/10 08:09:55 AMby Billy Williams
Chasing every opportunity in the market only leads to losses. Sometimes, the best trading tool a pro can use is simply being selective.
Position: Buy
| The market offers many opportunities to make money and, for aspiring traders, it's like being a kid in the candy store where there are lots of possibilities and they all look appealing. But more than cavities can result through poor choices for traders if they give in to the temptation of trying to partake of treats offered by the market. Overindulgent trading can result in a string of big losses with very little benefit, and that's why being selective is critical not just for profits but for staying power in a profession where many quit in frustration, even bitterness, after a short time. Trading should be rewarded by balancing the potential for loss with the exhilaration of solid gains earned with the discipline to stick to proven methods. One of the greatest tools a trader can have is simply being selective about the stock you trade, accomplished by making sure that you pick stocks that help you meet your objectives. You have to make sure it complements your trading method. |

|
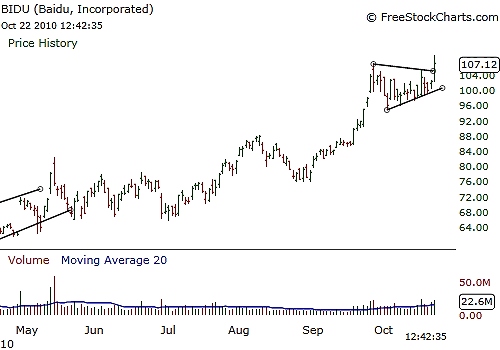
| FIGURE 1: BIDU. BIDU's primary trend is solidly in place, offering low-risk entries after periods of price consolidation, as revealed in this flag pattern. |
| Graphic provided by: www.freestockcharts.com. |
| |
| In the current market environment, this is especially true for momentum traders, as the market seems to be offering a lot of opportunities. However, keep in mind that as momentum traders you must remain diligent about picking stocks that are near their price highs, moving in the direction of the primary trend, and showing strength relative to the overall market. Baidu.com (Figure 1) has gone through a period of consolidation near its highs as both buyers and sellers are digesting their gains and/or weighting the logic of profit-taking, holding still in their positions, or buying into a new position and/or adding to an existing condition. Baidu has been a personal favorite since I nailed the trade back in February 2009 as it popped up through a protected period of price contraction and has offered numerous entries along its bullish run since then. The only thing that troubles me is that the stock has had an incredible run, but looks like it, and the market as a whole, is getting tired, so trade with caution and consider using options with high delta to control your risk. |

|
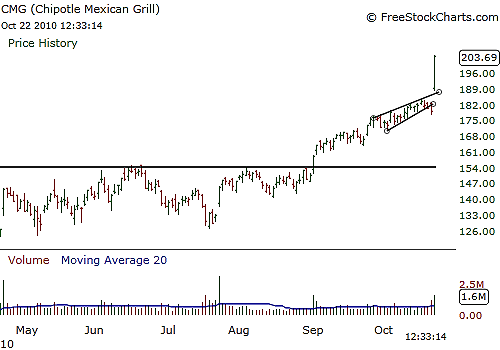
| FIGURE 2: CMG. CMG traded upward within a narrow price channel, but the huge breakout in price and volume show strong momentum to the upside. |
| Graphic provided by: www.freestockcharts.com. |
| |
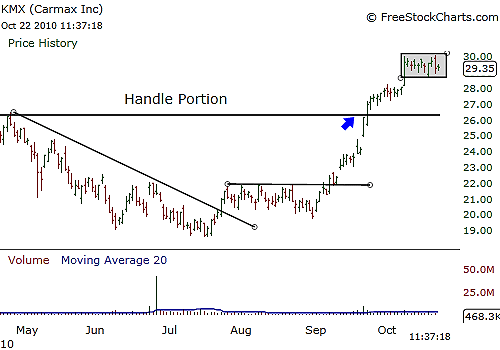
| If the burritos weren't enough of a reason to like restaurant chain Chipotle's (CMG), then the price action on their stock is. CMG (Figure 2) was trading along a tight channel to the upside after breaking through a five-month trading range, emerging into a bull run on high volume. Now, price has punched through the upper price level of the bullish channel, giving a clear signal that traders are bullish on the stock. If you're aggressive and actively watching, then the open of October 22 was a clear signal. Carmax (KMX) stock is also consolidating near its all-time high just as its stock traded up through the upper pivot point of a large cup & handle pattern on its monthly price chart that formed over the last five years' worth of price data (Figure 3). The stock firmed up near the bottom of the handle portion of the pattern on its ascent to the buy pivot, breaking out on strong trade volume. |

|
| FIGURE 3: KMX. KMX's price action showed the stock firming up near the bottom of the handle portion on the larger time frame's cup & handle pattern. Price seems to be taking a pause before resuming its bullish run. |
| Graphic provided by: www.freestockcharts.com. |
| |
| The consolidation near its high reveals a momentary pause before resuming its bull run, making this a good place to watch for a low-risk entry in a stock that is showing increasing strength compared to the rest of the market. |

|
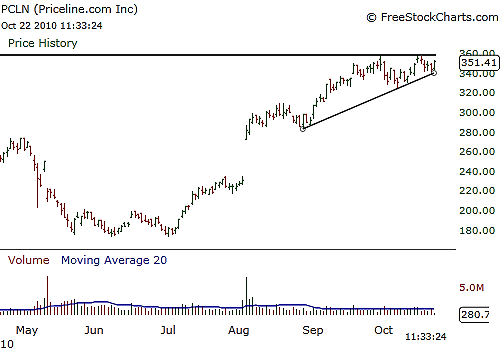
| FIGURE 4: PCLN. PCLN's primary bullish trend is putting pressure on its price action, consolidating near its highs. A breakout could be forthcoming at any moment. |
| Graphic provided by: www.freestockcharts.com. |
| |
| With the weak US economy, travelers are eagerly seeking bargains for vacation and business travel, as revealed by Priceline.com (PCLN) stock's bullish trend, which is solidly in place and trading near an all-time high (Figure 4). Studies by Blackstar Funds show that there is a significant edge in buying stocks at new all-time highs, which often outperform the Russell 3000 by as much as 500% overall. This quantitative edge coupled with PCLN's price action consolidating near those highs reveals a potential low-risk entry point if price trades through the upper price level of the consolidation point. Balance your stock selections with good trade and money management, always mindful of risk as well as the highest potential. |
Billy Williams has been trading the markets for 27 years, specializing in momentum trading with stocks and options.
| Company: | StockOptionSystem.com |
| E-mail address: | stockoptionsystem.com@gmail.com |
Traders' Resource Links | |
| StockOptionSystem.com has not added any product or service information to TRADERS' RESOURCE. | |
Click here for more information about our publications!
Comments
Date: 11/02/10Rank: 2Comment:

Request Information From Our Sponsors
- VectorVest, Inc.
- Executive Premier Workshop
- One-Day Options Course
- OptionsPro
- Retirement Income Workshop
- Sure-Fire Trading Systems (VectorVest, Inc.)
- Trading as a Business Workshop
- VectorVest 7 EOD
- VectorVest 7 RealTime/IntraDay
- VectorVest AutoTester
- VectorVest Educational Services
- VectorVest OnLine
- VectorVest Options Analyzer
- VectorVest ProGraphics v6.0
- VectorVest ProTrader 7
- VectorVest RealTime Derby Tool
- VectorVest Simulator
- VectorVest Variator
- VectorVest Watchdog
- StockCharts.com, Inc.
- Candle Patterns
- Candlestick Charting Explained
- Intermarket Technical Analysis
- John Murphy on Chart Analysis
- John Murphy's Chart Pattern Recognition
- John Murphy's Market Message
- MurphyExplainsMarketAnalysis-Intermarket Analysis
- MurphyExplainsMarketAnalysis-Visual Analysis
- StockCharts.com
- Technical Analysis of the Financial Markets
- The Visual Investor
