HOT TOPICS LIST
- MACD
- Fibonacci
- RSI
- Gann
- ADXR
- Stochastics
- Volume
- Triangles
- Futures
- Cycles
- Volatility
- ZIGZAG
- MESA
- Retracement
- Aroon
INDICATORS LIST
LIST OF TOPICS
PRINT THIS ARTICLE
by Billy Williams
Chart patterns reveal strong breakaway moves by scanning different time periods, but if you follow a few simple steps, you can enter early for more profits.
Position: Hold
Billy Williams
Billy Williams has been trading the markets for 27 years, specializing in momentum trading with stocks and options.
PRINT THIS ARTICLE
Early Entry Patterns In Breakaway Stocks
10/25/10 10:04:45 AMby Billy Williams
Chart patterns reveal strong breakaway moves by scanning different time periods, but if you follow a few simple steps, you can enter early for more profits.
Position: Hold
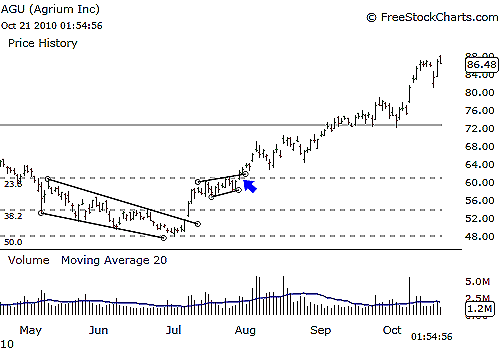
| Flat-based patterns, cup & handle patterns, rectangle patterns, ascending triangle patterns, and other chart patterns often associated with momentum trading have proven to be some of the most effective low-risk setups for traders to exploit for profit. To the skilled trader who is well-versed in these types of price formations combined with good stock selection as well a disciplined method for money and trade management, the stock market offers a universe of opportunities. However, just looking at a book on chart patterns isn't enough to grow in skill at spotting them, much less trading them. Successful identification of chart patterns is training your mind for visual cues from a stock's price action in order to imprint the pattern in your brain; otherwise, the pattern will be camouflaged among the wild gyrations of price movement, hidden from traders hungry for profitable opportunities. See Figure 1. |

|
| FIGURE 1: AGU. AGU's price retraced down to the 0.50 Fibonacci level on the larger time frame before a descending wedge revealed the point of reversal. Any easy entry was signaled by a contracted price point as the trend resumed upward. |
| Graphic provided by: www.freestockcharts.com. |
| |
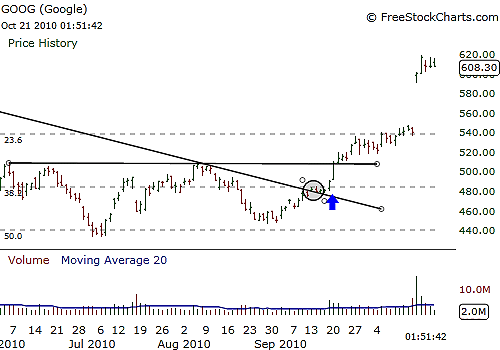
| You gain this skill by scanning charts, often hours at a time, in order to build up your awareness of what is going on in the market. Chart patterns are often a reflection of the mass psychology of the traders who make up the buying and selling on any given day, which, to a skilled technician, can reveal not only the trend in place but when that trend is likely to end. More important, by mastering chart patterns you can start to scale down in time frames in order to spot low-risk entries to catch an early ride into a move forming up. See Figure 2. Markets move through differing periods of expansion and contraction. Expansion exists when price is moving in a definite direction where either one side, buyers or sellers, have taken firm control of a stock causing its price to increase or decrease in value. |

|
| FIGURE 2: GOOG. GOOG's larger time frame revealed a 0.50 Fibonacci retracement where a likely reversal would take place back into the direction of the primary bullish trend. An inverse head & shoulders pattern revealed a low-risk entry at this critical price level. |
| Graphic provided by: www.freestockcharts.com. |
| |
| Contraction exists when neither side has taken control of a stock and the result is that price just drifts, oscillating up and down between two different price levels. Now, there are differing degrees of expansion or contraction in the market, depending on the variable of time. For example, price may be contracting on the weekly price chart over the last six months but by scaling down to the daily price chart over the last two months' worth of price data, you can begin to see price trending up and down between the two different price levels on the larger time frame, and here is where the opportunity lies. As chart patterns begin to emerge on larger time frames, the opportunity to enter the trend on a smaller time period is likely to get you in early on a breakaway move. The advantage is that you not only make more money but are less likely to be shaken out of a trade by traditional entry levels at key price pivots. Flat-based patterns are notorious for attracting scores of buyers as price trades through its upper or lower price levels, but price may quickly reverse due to price manipulation by the floor traders or just not enough trade volume for price to follow through. |
| Yet, by scaling down in price where support and resistance is easily identifiable, you can scan for noticeable price patterns offered on that time period with a directional bias in favor of the dominant trend. Then, when the chart pattern on the larger time frame begins to fully mature, you've managed to catch the move early on with the added advantage of greater returns. Look for areas in a stock's price action where contraction is taking place followed by strong thrusts in the expected direction of the trend. This should be accompanied by higher than average volume and/or gaps in price also in the direction of the expected trend. |
Billy Williams has been trading the markets for 27 years, specializing in momentum trading with stocks and options.
| Company: | StockOptionSystem.com |
| E-mail address: | stockoptionsystem.com@gmail.com |
Traders' Resource Links | |
| StockOptionSystem.com has not added any product or service information to TRADERS' RESOURCE. | |
Click here for more information about our publications!
Comments

Request Information From Our Sponsors
- StockCharts.com, Inc.
- Candle Patterns
- Candlestick Charting Explained
- Intermarket Technical Analysis
- John Murphy on Chart Analysis
- John Murphy's Chart Pattern Recognition
- John Murphy's Market Message
- MurphyExplainsMarketAnalysis-Intermarket Analysis
- MurphyExplainsMarketAnalysis-Visual Analysis
- StockCharts.com
- Technical Analysis of the Financial Markets
- The Visual Investor
- VectorVest, Inc.
- Executive Premier Workshop
- One-Day Options Course
- OptionsPro
- Retirement Income Workshop
- Sure-Fire Trading Systems (VectorVest, Inc.)
- Trading as a Business Workshop
- VectorVest 7 EOD
- VectorVest 7 RealTime/IntraDay
- VectorVest AutoTester
- VectorVest Educational Services
- VectorVest OnLine
- VectorVest Options Analyzer
- VectorVest ProGraphics v6.0
- VectorVest ProTrader 7
- VectorVest RealTime Derby Tool
- VectorVest Simulator
- VectorVest Variator
- VectorVest Watchdog
