HOT TOPICS LIST
- MACD
- Fibonacci
- RSI
- Gann
- ADXR
- Stochastics
- Volume
- Triangles
- Futures
- Cycles
- Volatility
- ZIGZAG
- MESA
- Retracement
- Aroon
INDICATORS LIST
LIST OF TOPICS
PRINT THIS ARTICLE
by Alan R. Northam
Many market participants have become extremely bullish. It is time to put the market into perspective by comparing current price action to that of the Dow theory.
Position: N/A
Alan R. Northam
Alan Northam lives in the Dallas, Texas area and as an electronic engineer gave him an analytical mind from which he has developed a thorough knowledge of stock market technical analysis. His abilities to analyze the future direction of the stock market has allowed him to successfully trade of his own portfolio over the last 30 years. Mr. Northam is now retired and trading the stock market full time. You can reach him at inquiry@tradersclassroom.com or by visiting his website at http://www.tradersclassroom.com. You can also follow him on Twitter @TradersClassrm.
PRINT THIS ARTICLE
DOW THEORY
Revisiting Dow Theory
10/22/10 08:43:46 AMby Alan R. Northam
Many market participants have become extremely bullish. It is time to put the market into perspective by comparing current price action to that of the Dow theory.
Position: N/A
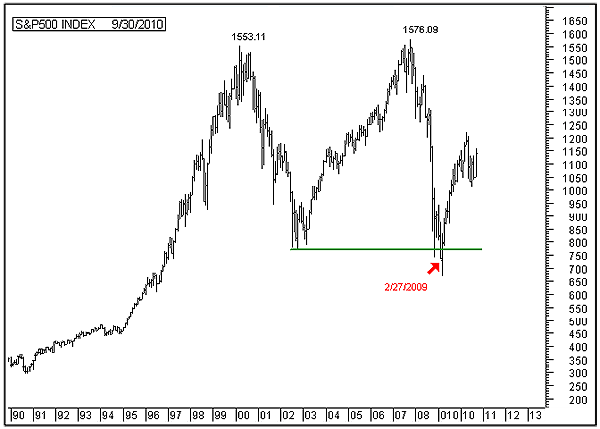
| Figure 1 is that of the monthly chart of the Standard & Poor's 500. As can be seen, price made a new long-term bull market high of 1576.09 in October 2007. Price then sold off over the following 17 months to close below the 2002 low in February 2009 to end the long-term bull market rally. In applying the Dow theory from Robert Rhea's book The Dow Theory, a bull market ends when price breaks down below the low of the latest reaction of a bull market. Here is what Robert Rhea writes in his book: "When declines in a primary bull market result in violating the lowest points encountered during the last major secondary reaction of that market, it may generally be assumed that the primary trend has changed from bullish to bearish." The Dow theory also states that after price breaks down below the low of the latest reaction, price must make a new high above the highest high of the bull market rally to confirm that the bull market is still in progress. Thus, the S&P 500 must move back above 1576.09 to confirm that the bull market is not over. Until then, the market is considered to be in a bear market. The following is an interpretation of the Dow theory insofar as the last major secondary reaction that ended in 2002 has been violated. |

|
| FIGURE 1: S&P 500, MONTHLY. This chart shows price breaking down below the final secondary reaction of the bull market and ending the long-term bull market rally. |
| Graphic provided by: MetaStock. |
| |
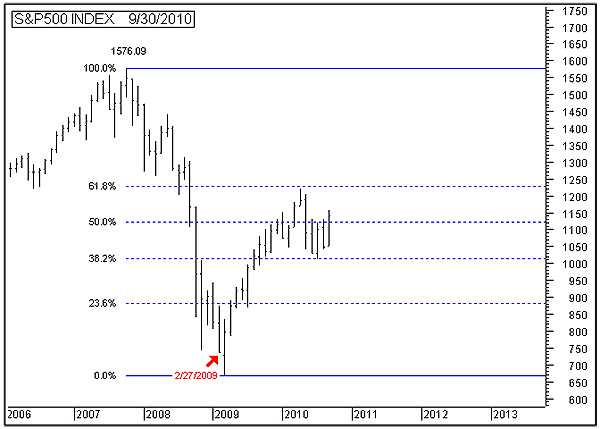
| Now look at the current rally that started in early 2009. In Figure 2, I have zoomed in on the monthly chart of the S&P 500 and added the Fibonacci retracement lines. With the bull market now having ended, the upward rally is considered to be the first of two expected secondary reactions, or corrections, of the new bear market. (The Dow theory calls corrections "secondary reactions.") I added the Fibonacci retracement lines to measure the retracement of this first corrective rally. As can be seen, the S&P 500 has moved up to the 61.8% retracement of the previous decline from the market top at 1576.09. Dow theory states that secondary reactions retrace from one third to two thirds of the previous decline. Thus, a retracement of 61.8% is within the guidelines of a correction according to the theory. Note that price is now in the early stage of working its way lower. |

|
| FIGURE 2: S&P 500, MONTHLY. This chart shows the first of two expected secondary reactions within the ongoing bear market ending after retracing 61.8% of its first decline. |
| Graphic provided by: MetaStock. |
| |
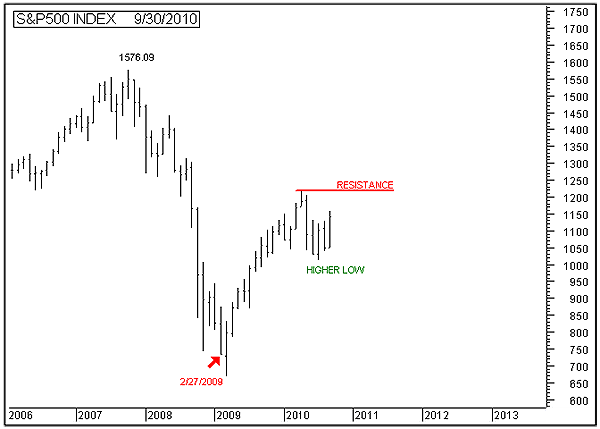
| In Figure 3 I removed the Fibonacci retracement lines and drew a resistance line off the high point of the price reversal made in early 2010. I also marked the most recent low as "higher low." Dow theory states that before a rally can be considered to be bullish, it must do two things. One: Price must make a higher low. Dow theory considers a higher low to be a retest of the lowest price of the preceding decline. In our case, the higher low was made in July 2010 and is marked "higher low" on the chart. Two: The market must make a new higher high. This is why I added the resistance line. For whatever reason, the market has considered this price level to be an important price point at which the market does not want to cross. In May 2010, price respected this price point and turned back down, forming a price reversal pattern. Now, price is moving upward again to test this price reversal point. However, the market has a way of remembering previous reversal points and price may turn back down before reaching this reversal point. Therefore, if the market breaks out above this line of resistance making a new higher high, Dow theory considers this to be important and labels the upward rally as bullish. Now here is the kicker: Dow theory considers a rally that forms a higher low and a higher high to be bullish in nature but does not necessarily consider it to be the start of a bull market trend. |

|
| FIGURE 2: S&P 500, MONTHLY. This chart shows price moving upward to test resistance. |
| Graphic provided by: MetaStock. |
| |
| Now for a warning: Should price move above the red horizontal resistance line and make a higher high signaling that a bullish rally in progress, that rally can still fail before making a high above the highest high of the previous bull market (1576.09) and turn back down. This is known as a price failure. Further if the market turns back down before moving above 1576.09 and moves below the low made in early 2009, just the opposite will have occurred, the market will have confirmed the bear market trend. |
| In conclusion, it is way too early for the bulls to declare that the bull market remains in progress. As it currently stands, the S&P 500 has broken down below the low made in 2002, ending the long-term bull market trend. Under such circumstances, price must now move back above the highest high of the bull market to signal that the bull is still in progress. Until that happens, Dow theory considers the upward rally to be the first of two expected secondary reactions within a new bear market. |
Alan Northam lives in the Dallas, Texas area and as an electronic engineer gave him an analytical mind from which he has developed a thorough knowledge of stock market technical analysis. His abilities to analyze the future direction of the stock market has allowed him to successfully trade of his own portfolio over the last 30 years. Mr. Northam is now retired and trading the stock market full time. You can reach him at inquiry@tradersclassroom.com or by visiting his website at http://www.tradersclassroom.com. You can also follow him on Twitter @TradersClassrm.
| Garland, Tx | |
| Website: | www.tradersclassroom.com |
| E-mail address: | inquiry@tradersclassroom.com |
Click here for more information about our publications!
PRINT THIS ARTICLE

Request Information From Our Sponsors
- StockCharts.com, Inc.
- Candle Patterns
- Candlestick Charting Explained
- Intermarket Technical Analysis
- John Murphy on Chart Analysis
- John Murphy's Chart Pattern Recognition
- John Murphy's Market Message
- MurphyExplainsMarketAnalysis-Intermarket Analysis
- MurphyExplainsMarketAnalysis-Visual Analysis
- StockCharts.com
- Technical Analysis of the Financial Markets
- The Visual Investor
- VectorVest, Inc.
- Executive Premier Workshop
- One-Day Options Course
- OptionsPro
- Retirement Income Workshop
- Sure-Fire Trading Systems (VectorVest, Inc.)
- Trading as a Business Workshop
- VectorVest 7 EOD
- VectorVest 7 RealTime/IntraDay
- VectorVest AutoTester
- VectorVest Educational Services
- VectorVest OnLine
- VectorVest Options Analyzer
- VectorVest ProGraphics v6.0
- VectorVest ProTrader 7
- VectorVest RealTime Derby Tool
- VectorVest Simulator
- VectorVest Variator
- VectorVest Watchdog
