HOT TOPICS LIST
- MACD
- Fibonacci
- RSI
- Gann
- ADXR
- Stochastics
- Volume
- Triangles
- Futures
- Cycles
- Volatility
- ZIGZAG
- MESA
- Retracement
- Aroon
INDICATORS LIST
LIST OF TOPICS
PRINT THIS ARTICLE
by Chaitali Mohile
NEV is likely to ignore bearish indications while consolidating. This technical chart can help newer traders recognize breakout conditions.
Position: N/A
Chaitali Mohile
Active trader in the Indian stock markets since 2003 and a full-time writer. Trading is largely based upon technical analysis.
PRINT THIS ARTICLE
CONSOLID FORMATION
NEV Undergoing Long Consolidation
10/25/10 02:47:12 PMby Chaitali Mohile
NEV is likely to ignore bearish indications while consolidating. This technical chart can help newer traders recognize breakout conditions.
Position: N/A
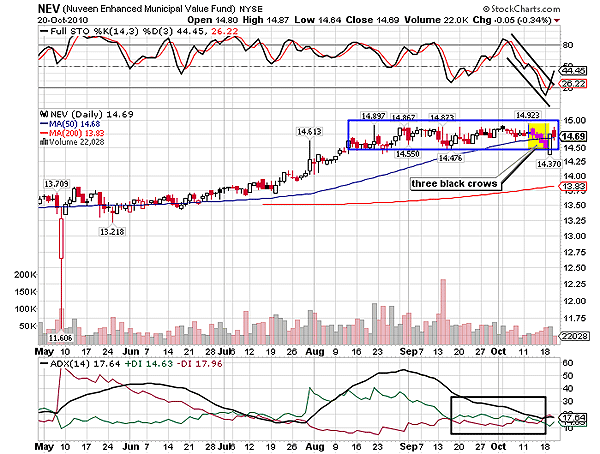
| According to the daily chart in Figure 1, Nuveen Enhanced Municipal Fund (NEV) had the strong support of the 50-day moving average (MA). Though NEV was in an intermediate downtrend from May to July, the stock rallied with the 50-day MA support. The average directional index (ADX) (14) in Figure 1 moved from developing to the overheated downtrend region, and later, descended to the lower levels. The full stochastic (14,3,3) was ranged in a bullish area between 50 and 80 levels. The bullish movement of the momentum oscillator -- full stochastic -- helped the price rally sustain the 50-day MA support. As soon as the downtrend turned weaker, the stock surged. |
| However, the advance rally hardly moved and instead turned sideways. The bullish rally generated fresh buying pressure, initiating a new uptrend for NEV. The uptrend was developing even though the price was consolidating. Thereafter, the stock has been ranging between 15 and 14.50. We can see many small upper shadows that developed the upper range, and many doji candlesticks were formed during sideways price action in Figure 1. This indicated high volatility, which affected the volume. Recently, NEV formed three black crows -- a bearish reversal candlestick formation -- indicating a bearish breakout of the bullish consolidation. |

|
| FIGURE 1: NEV, DAILY |
| Graphic provided by: StockCharts.com. |
| |
| The yellow block marked in Figure 1 shows the candlestick formation as well as the bearish breakout of the 50-day MA support. But the surging stochastic from the oversold levels prevented the breakdown of the lower range. Looking at the bearish breakout, any fresh traders might rush to enter a short position anticipating a bearish breakout but they may get whipsawed. Thus, traders may want to consider waiting for a confirmed breakout and not strike any trade in anticipation. |
| The large bullish candle in Figure 1 has engulfed the previous two bearish candlesticks, generating robust bullish strength and protected a downside breakout. The volume is still low, indicating lack of confidence among traders. The full stochastic (14,3,3) is ready to surge above 50 levels and the ADX (14) is indicating that the stock would continue to consolidate. Both indicators have turned bullish for the upward breakout or weak for the bearish breakout. |
| Thus, breakout conditions can be identified on any technical chart in a similar fashion. |
Active trader in the Indian stock markets since 2003 and a full-time writer. Trading is largely based upon technical analysis.
| Company: | Independent |
| Address: | C1/3 Parth Indraprasth Towers. Vastrapur |
| Ahmedabad, Guj 380015 | |
| E-mail address: | chaitalimohile@yahoo.co.in |
Traders' Resource Links | |
| Independent has not added any product or service information to TRADERS' RESOURCE. | |
Click here for more information about our publications!
PRINT THIS ARTICLE

Request Information From Our Sponsors
- StockCharts.com, Inc.
- Candle Patterns
- Candlestick Charting Explained
- Intermarket Technical Analysis
- John Murphy on Chart Analysis
- John Murphy's Chart Pattern Recognition
- John Murphy's Market Message
- MurphyExplainsMarketAnalysis-Intermarket Analysis
- MurphyExplainsMarketAnalysis-Visual Analysis
- StockCharts.com
- Technical Analysis of the Financial Markets
- The Visual Investor
- VectorVest, Inc.
- Executive Premier Workshop
- One-Day Options Course
- OptionsPro
- Retirement Income Workshop
- Sure-Fire Trading Systems (VectorVest, Inc.)
- Trading as a Business Workshop
- VectorVest 7 EOD
- VectorVest 7 RealTime/IntraDay
- VectorVest AutoTester
- VectorVest Educational Services
- VectorVest OnLine
- VectorVest Options Analyzer
- VectorVest ProGraphics v6.0
- VectorVest ProTrader 7
- VectorVest RealTime Derby Tool
- VectorVest Simulator
- VectorVest Variator
- VectorVest Watchdog
