HOT TOPICS LIST
- MACD
- Fibonacci
- RSI
- Gann
- ADXR
- Stochastics
- Volume
- Triangles
- Futures
- Cycles
- Volatility
- ZIGZAG
- MESA
- Retracement
- Aroon
INDICATORS LIST
LIST OF TOPICS
PRINT THIS ARTICLE
by Chaitali Mohile
Amex Composite has hit near-term resistance. Will the index go through a serious correction, resulting in a trend reversal?
Position: Sell
Chaitali Mohile
Active trader in the Indian stock markets since 2003 and a full-time writer. Trading is largely based upon technical analysis.
PRINT THIS ARTICLE
CHART ANALYSIS
Amex Composite On Reverse Journey?
10/20/10 01:24:32 PMby Chaitali Mohile
Amex Composite has hit near-term resistance. Will the index go through a serious correction, resulting in a trend reversal?
Position: Sell
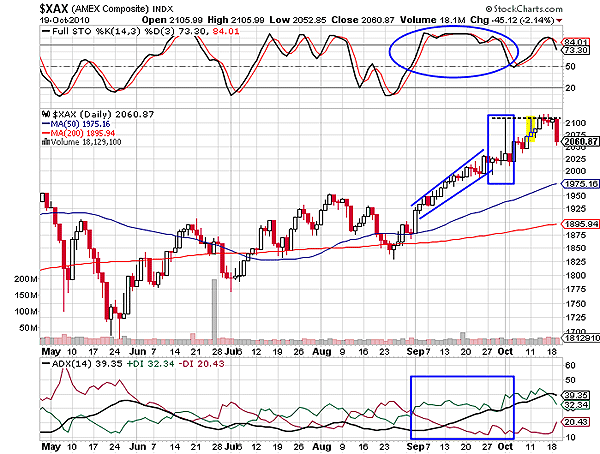
| The Amex Composite ($XAX) geared up a bullish rally with the support of the 50-day moving average (MA) in September 2010. After climbing 100 points from the support, $XAX formed a long upper shadow candle with a small real body -- a shooting star (see Figure 1). Although the shooting star candlestick is a bearish reversal pattern that indicates a top formation in a particular stock or index, $XAX has continued its journey. The trend indicator, average directional index (ADX) (14), and the full stochastic (14,3,3) were not in sync with the candlestick formation. The uptrend was developing and the stochastic surged, establishing support at 50 levels. Since the indicators were in a bullish mood, the shooting star failed to terminate the rally. Later, another shooting star was formed with an intraday high above 2100 levels. We can see that both the shooting stars have the same high pivot (see the dotted line in Figure 1). Therefore, the long upper shadows have generated robust resistance above 2100 levels, and as a result, the index moved sideways. |

|
| FIGURE 1: $XAX, DAILY |
| Graphic provided by: StockCharts.com. |
| |
| During the consolidation, $XAX formed doji candlesticks, suggesting the possibility of a reversal rally. This time, the momentum oscillator is tipped down and ready to plunge along with the price action and the uptrend also is likely to descend. Thus, the index would retrace toward its immediate support of the 50-day MA, losing around 100 points. |

|
| FIGURE 2: $XAX, MONTHLY |
| Graphic provided by: StockCharts.com. |
| |
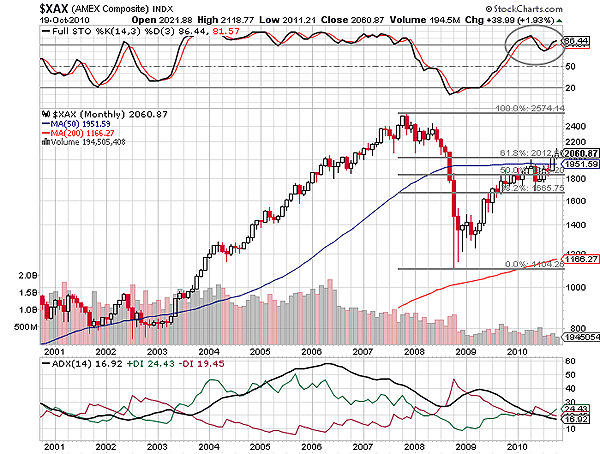
| According to the monthly time frame seen in Figure 2, $XAX has recently witnessed a bullish MA breakout. The 50-day MA resistance is converted to support. After the breakout, the index hit the 61.8% Fibonacci retracement levels. The stochastic oscillator is shaky in the highly overbought area above 80 levels. The downtrend indicated by the ADX (14) in Figure 1 has turned weaker and shows the possibility of consolidation. The stock enters consolidation if the buying pressure reflected by the positive directional index (+DI) and the selling pressure shown by the negative directional index (-DI) are converging as well as if the ADX line slips below 20 levels. Therefore, $XAX is likely to move sideways between the 61.8% and the 50% Fibonacci retracement levels. |
| Thus, the short-term correction of $XAX would lead to a consolidation in the long term. |
Active trader in the Indian stock markets since 2003 and a full-time writer. Trading is largely based upon technical analysis.
| Company: | Independent |
| Address: | C1/3 Parth Indraprasth Towers. Vastrapur |
| Ahmedabad, Guj 380015 | |
| E-mail address: | chaitalimohile@yahoo.co.in |
Traders' Resource Links | |
| Independent has not added any product or service information to TRADERS' RESOURCE. | |
Click here for more information about our publications!
PRINT THIS ARTICLE

|

Request Information From Our Sponsors
- StockCharts.com, Inc.
- Candle Patterns
- Candlestick Charting Explained
- Intermarket Technical Analysis
- John Murphy on Chart Analysis
- John Murphy's Chart Pattern Recognition
- John Murphy's Market Message
- MurphyExplainsMarketAnalysis-Intermarket Analysis
- MurphyExplainsMarketAnalysis-Visual Analysis
- StockCharts.com
- Technical Analysis of the Financial Markets
- The Visual Investor
- VectorVest, Inc.
- Executive Premier Workshop
- One-Day Options Course
- OptionsPro
- Retirement Income Workshop
- Sure-Fire Trading Systems (VectorVest, Inc.)
- Trading as a Business Workshop
- VectorVest 7 EOD
- VectorVest 7 RealTime/IntraDay
- VectorVest AutoTester
- VectorVest Educational Services
- VectorVest OnLine
- VectorVest Options Analyzer
- VectorVest ProGraphics v6.0
- VectorVest ProTrader 7
- VectorVest RealTime Derby Tool
- VectorVest Simulator
- VectorVest Variator
- VectorVest Watchdog
