HOT TOPICS LIST
- MACD
- Fibonacci
- RSI
- Gann
- ADXR
- Stochastics
- Volume
- Triangles
- Futures
- Cycles
- Volatility
- ZIGZAG
- MESA
- Retracement
- Aroon
INDICATORS LIST
LIST OF TOPICS
PRINT THIS ARTICLE
by Donald W. Pendergast, Jr.
Some market turns are more easily anticipated than others. This sharp turn in the US Dollar Index was no surprise, given the extremes of bearish sentiment prevailing leading up to the reversal.
Position: Buy
Donald W. Pendergast, Jr.
Donald W. Pendergast is a financial markets consultant who offers specialized services to stock brokers and high net worth individuals who seek a better bottom line for their portfolios.
PRINT THIS ARTICLE
REVERSAL
DX Turning Higher As Metals Falter
10/20/10 09:01:56 AMby Donald W. Pendergast, Jr.
Some market turns are more easily anticipated than others. This sharp turn in the US Dollar Index was no surprise, given the extremes of bearish sentiment prevailing leading up to the reversal.
Position: Buy
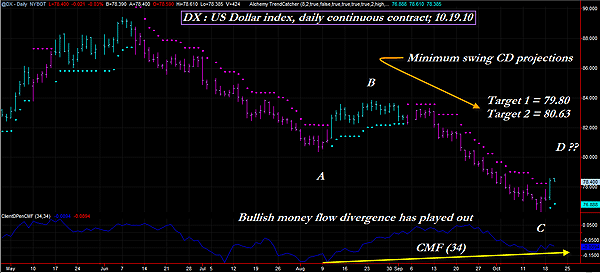
| A couple of weeks ago, I made the technical case here in Traders.com Advantage for a likely bullish reversal in the US Dollar Index (DX) somewhere just above the 76.00 price zone, based on a combination of major swing analysis and Keltner band confluence. The price action of the last four daily price bars leaves little doubt that the reversal is the real deal, although it would not be surprising to see some "back and fill" gyrations (and perhaps even a minor double-bottom pattern). The percentage of dollar bulls among large speculator interests (hedge funds and so on) was at a minuscule level at the low (based on recent Commitments of Traders analysis), and that also figured into the confidence level proffered by the Keltner/swing support levels between $76.00 and $76.75. Not surprisingly, the gold and silver futures markets have also begun notable reversals (lower) as the dollar begins to attract more buying interest. Playing the dollar versus precious metals market dynamic is one of the highest-probability trading games around, and it looks to be right on target again -- as it normally is at major trend reversals. So how far might this dollar rally go before overhead supply thwarts further upward progress, at least temporarily? Let's look at the daily chart of the US Dollar Index continuous contract futures to see if there are any clues we can use (Figure 1). |

|
| FIGURE 1: DX, DAILY. Alphabet soup or sound trading analysis? Maybe it's a little of both, but using some basic swing price projection formulas can still help make your trading method more objective and profitable. |
| Graphic provided by: TradeStation. |
| Graphic provided by: Trading Alchemy.com TrendCatcher. |
| |
| Since we used some basic arithmetic to arrive at the swing BC price target in a previous TCA article, let's do the same thing to project a couple of possible terminus points for swing CD in progress. Swing AB measured a paltry 3.47 points so we'll simply add that to the value of point C, which is 76.335, to arrive at a projection of 79.80. Since this value is nearly identical to the 50% Fibonacci retracement of swing BC (79.70), this is definitely a price to look for some short-term profit taking to occur. However, if this is a major trend reversal, then the Fibonacci 62% retracement at $80.63 is likely a better area to expect a potential resistance area to manifest. Finally, if we multiply the AB 3.47 point swing by 1.618 and add the product to the swing BC low of 76.335 [([3.47 * 1.618] + 76.335) = 81.95], we find a more extreme price zone in which to expect a reversal and/or pause of swing CD. These are not guaranteed reversal/stall areas, but using a simple, consistent formula like this can add an extra measure of rationality and objectivity to your trading regimen. Try using the swing formula on the various swings you identify in the silver and gold markets, as they can be applied to any market that makes strong, sustained swing moves. |
Donald W. Pendergast is a financial markets consultant who offers specialized services to stock brokers and high net worth individuals who seek a better bottom line for their portfolios.
| Title: | Writer, market consultant |
| Company: | Linear Trading Systems LLC |
| Jacksonville, FL 32217 | |
| Phone # for sales: | 904-239-9564 |
| E-mail address: | lineartradingsys@gmail.com |
Traders' Resource Links | |
| Linear Trading Systems LLC has not added any product or service information to TRADERS' RESOURCE. | |
Click here for more information about our publications!
Comments
Date: 10/26/10Rank: 5Comment:

Request Information From Our Sponsors
- StockCharts.com, Inc.
- Candle Patterns
- Candlestick Charting Explained
- Intermarket Technical Analysis
- John Murphy on Chart Analysis
- John Murphy's Chart Pattern Recognition
- John Murphy's Market Message
- MurphyExplainsMarketAnalysis-Intermarket Analysis
- MurphyExplainsMarketAnalysis-Visual Analysis
- StockCharts.com
- Technical Analysis of the Financial Markets
- The Visual Investor
- VectorVest, Inc.
- Executive Premier Workshop
- One-Day Options Course
- OptionsPro
- Retirement Income Workshop
- Sure-Fire Trading Systems (VectorVest, Inc.)
- Trading as a Business Workshop
- VectorVest 7 EOD
- VectorVest 7 RealTime/IntraDay
- VectorVest AutoTester
- VectorVest Educational Services
- VectorVest OnLine
- VectorVest Options Analyzer
- VectorVest ProGraphics v6.0
- VectorVest ProTrader 7
- VectorVest RealTime Derby Tool
- VectorVest Simulator
- VectorVest Variator
- VectorVest Watchdog
