HOT TOPICS LIST
- MACD
- Fibonacci
- RSI
- Gann
- ADXR
- Stochastics
- Volume
- Triangles
- Futures
- Cycles
- Volatility
- ZIGZAG
- MESA
- Retracement
- Aroon
INDICATORS LIST
LIST OF TOPICS
PRINT THIS ARTICLE
by Koos van der Merwe
Yes, I do watch the Dow like a hawk, simply because top analysts preach the bear on CNBC.
Position: Hold
Koos van der Merwe
Has been a technical analyst since 1969, and has worked as a futures and options trader with First Financial Futures in Johannesburg, South Africa.
PRINT THIS ARTICLE
FIBONACCI
The Dow Revisited
10/19/10 11:47:25 AMby Koos van der Merwe
Yes, I do watch the Dow like a hawk, simply because top analysts preach the bear on CNBC.
Position: Hold
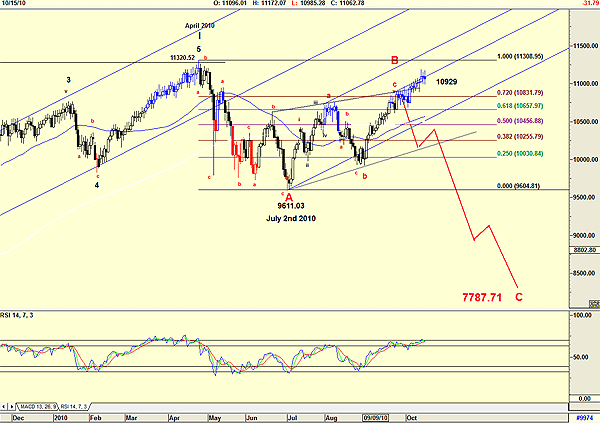
| In my last article on the Dow Jones Industrial Average (DJIA), I attempted to understand why experts like Robert Prechter and other well-known analysts are forecasting a double-dip recession. If you were following my chart, it would look like Figure 1. |

|
| FIGURE 1: DJIA. Here's the bear trend. |
| Graphic provided by: AdvancedGET. |
| |
| As you can see, the resistance at 1083.79, a 72% Fibonacci extension level, never held, although there was a slight retracement before a break through the resistance level. This means that my bear projection is so much wishful thinking. However, further analysis shows that we are nearing a level where a correction could well occur, but not the Halloween correction that the bears would like to see. Why am I expecting a correction? Look at Figure 2. |

|
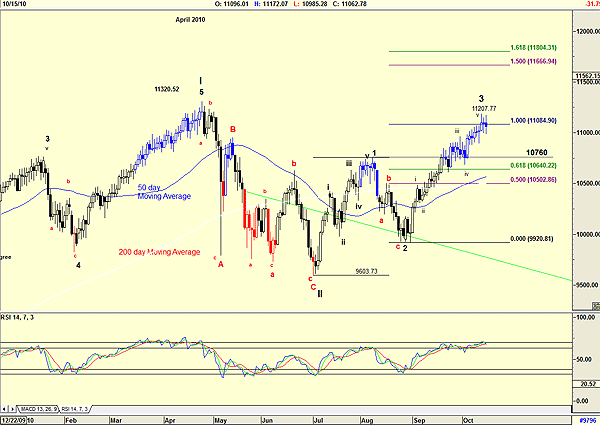
| FIGURE 2: DJIA. Here's the suggested target. |
| Graphic provided by: AdvancedGET. |
| |
| The DJIA broke above the resistance of wave 1 of Wave III and has risen to a price greater than 11,084.90, the Fibonacci extension of the movement of wave 1. Wave 1 of Wave III is 1156.27 (10760 - 9603.73) in length. The present length of wave 3 of Wave III is 1286.96 (11207.77 - 9920.81), greater than Wave 1. With the relative strength index (RSI) at oversold levels without giving a sell signal, we could well see the DJIA going higher to the 1.5% extension level of 11,666.94 or higher before a strong correction. Should this happen, there will be small corrections on the way up with a possible five-wave move, although on Figure 2, I have shown a minor five-wave count. How far could a fourth wave correction go? To answer this question, look at Figure 3. |

|
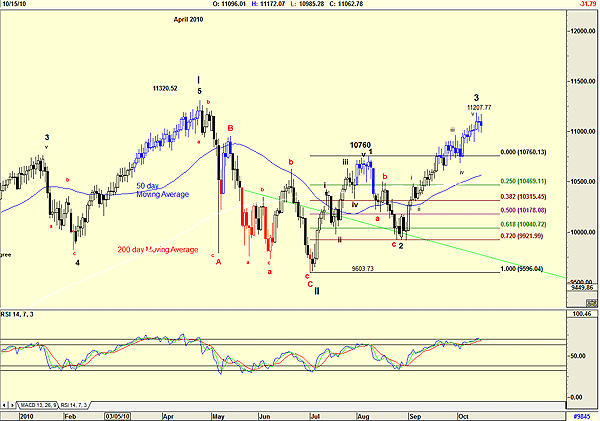
| FIGURE 3: DJIA. And here's a suggested wave 3. |
| Graphic provided by: AdvancedGET. |
| |
| Figure 3 shows that Wave 2 of Wave III retraced 72% in a simple abc pattern. This means that the wave 4 of Wave III correction when it occurs should not fall below the 10,760.13 level. If it does, then it means that the DJIA is charting a wave (2) of Wave 3 of Wave III with the level 11,207 or higher being wave(1) of Wave 3 of Wave III. Complicated? Yes, but it will signify that a major bull trend is under way, and that any correction is a buying opportunity. Finally, do note that the 50-day moving average has broken above the 200-day moving average. Enjoy the Elliott wave count. |
Has been a technical analyst since 1969, and has worked as a futures and options trader with First Financial Futures in Johannesburg, South Africa.
| Address: | 3256 West 24th Ave |
| Vancouver, BC | |
| Phone # for sales: | 6042634214 |
| E-mail address: | petroosp@gmail.com |
Click here for more information about our publications!
PRINT THIS ARTICLE

Request Information From Our Sponsors
- VectorVest, Inc.
- Executive Premier Workshop
- One-Day Options Course
- OptionsPro
- Retirement Income Workshop
- Sure-Fire Trading Systems (VectorVest, Inc.)
- Trading as a Business Workshop
- VectorVest 7 EOD
- VectorVest 7 RealTime/IntraDay
- VectorVest AutoTester
- VectorVest Educational Services
- VectorVest OnLine
- VectorVest Options Analyzer
- VectorVest ProGraphics v6.0
- VectorVest ProTrader 7
- VectorVest RealTime Derby Tool
- VectorVest Simulator
- VectorVest Variator
- VectorVest Watchdog
- StockCharts.com, Inc.
- Candle Patterns
- Candlestick Charting Explained
- Intermarket Technical Analysis
- John Murphy on Chart Analysis
- John Murphy's Chart Pattern Recognition
- John Murphy's Market Message
- MurphyExplainsMarketAnalysis-Intermarket Analysis
- MurphyExplainsMarketAnalysis-Visual Analysis
- StockCharts.com
- Technical Analysis of the Financial Markets
- The Visual Investor
