HOT TOPICS LIST
- MACD
- Fibonacci
- RSI
- Gann
- ADXR
- Stochastics
- Volume
- Triangles
- Futures
- Cycles
- Volatility
- ZIGZAG
- MESA
- Retracement
- Aroon
INDICATORS LIST
LIST OF TOPICS
PRINT THIS ARTICLE
by Koos van der Merwe
With today's bull market, we are always looking for stocks to buy for both the long term and the short term. Lexmark has been tipped by a number of newsletters and even advisors. Is it truly a buy?
Position: Buy
Koos van der Merwe
Has been a technical analyst since 1969, and has worked as a futures and options trader with First Financial Futures in Johannesburg, South Africa.
PRINT THIS ARTICLE
RSI
Is Lexmark A Buy?
10/14/10 09:34:23 AMby Koos van der Merwe
With today's bull market, we are always looking for stocks to buy for both the long term and the short term. Lexmark has been tipped by a number of newsletters and even advisors. Is it truly a buy?
Position: Buy
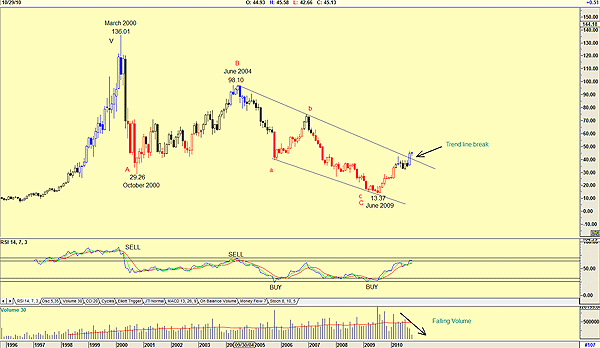
| Is Lexmark (LXK) a buy? Figure 1, a monthly chart, shows how the price fell from a high of $136.01 in March 2000, at the height of the bubble, to a low of $29.26 by October of that same year. The share price then recovered to $98.10 by June 2004, a period of four years, and then fell over the next five years to a low of $13.37 by June 2009. Elliott wave analysis suggests that Wave C is complete, and that the price could be tracing Wave 1 of a new bull market. The break of the trendline, which should have been a resistance level, suggests that a new bullish trend is on the cards. This bullish trend is reinforced by the relative strength index (RSI) line, which gave a buy signal when the price was $13.37 in June 2009. The RSI is currently at overbought levels, suggesting that a sell signal is in the offing. This weakness is also confirmed by the volume, which has been dropping as the price rose. |

|
| FIGURE 1: LEXMARK, MONTHLY |
| Graphic provided by: AdvancedGET. |
| |
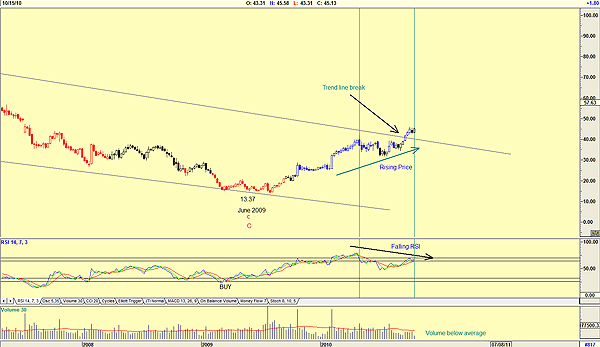
| Figure 2 is a weekly chart and shows the rising price on a volume that is below average with a falling RSI. This divergence is a very strong sell signal, confirmed by the falling volume. |

|
| FIGURE 2: LEXMARK, WEEKLY |
| Graphic provided by: AdvancedGET. |
| |
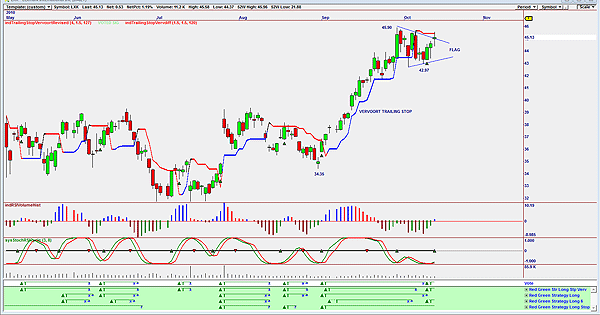
| Figure 3 is a chart more for traders than investors. It is an OmniTrader chart with the red/green strategy I use on an OmniTrader chart. (Formulas are available on request.) The strategy suggests a short-term buy signal, as shown on the vote line, as well as a buy signal on the indicator, the RSI volume histogram, and the stochastic RSI cycle indicator. The strategy works extremely well when used with the Vervoort trailing stop shown. Long-term investors should be cautious when investing in Lexmark International. Long-term charts are suggesting weakness. Traders, on the other hand, could take advantage of the flag formation that is forming, suggesting a target of $54.52 (45.90 - 34.35 = 11.55 + 42.97 = 54.52). |

|
| FIGURE 3: LEXMARK, DAILY. Here's a short-term buy signal. |
| Graphic provided by: OmniTrader. |
| |
Has been a technical analyst since 1969, and has worked as a futures and options trader with First Financial Futures in Johannesburg, South Africa.
| Address: | 3256 West 24th Ave |
| Vancouver, BC | |
| Phone # for sales: | 6042634214 |
| E-mail address: | petroosp@gmail.com |
Click here for more information about our publications!
Comments
Date: 10/20/10Rank: 5Comment: Hello from France,
As a Traders.com subscriber and Omnitrader user, I am interested in your RED/Green Strategy.
Thanks to you if you can email it to me,
Best regards,
Alphonse Martinod / France
regnis@msn.com = invalid mail adress
Date: 10/20/10Rank: 5Comment: Hello from France,
As a Traders.com subscriber and Omnitrader user, I am interested in your RED/Green Strategy.
Thanks to you if you can email it to me,
Best regards,
Alphonse Martinod / France
amartinod@free.fr
regnis@msn.com = invalid mail adress

Request Information From Our Sponsors
- StockCharts.com, Inc.
- Candle Patterns
- Candlestick Charting Explained
- Intermarket Technical Analysis
- John Murphy on Chart Analysis
- John Murphy's Chart Pattern Recognition
- John Murphy's Market Message
- MurphyExplainsMarketAnalysis-Intermarket Analysis
- MurphyExplainsMarketAnalysis-Visual Analysis
- StockCharts.com
- Technical Analysis of the Financial Markets
- The Visual Investor
- VectorVest, Inc.
- Executive Premier Workshop
- One-Day Options Course
- OptionsPro
- Retirement Income Workshop
- Sure-Fire Trading Systems (VectorVest, Inc.)
- Trading as a Business Workshop
- VectorVest 7 EOD
- VectorVest 7 RealTime/IntraDay
- VectorVest AutoTester
- VectorVest Educational Services
- VectorVest OnLine
- VectorVest Options Analyzer
- VectorVest ProGraphics v6.0
- VectorVest ProTrader 7
- VectorVest RealTime Derby Tool
- VectorVest Simulator
- VectorVest Variator
- VectorVest Watchdog
