HOT TOPICS LIST
- MACD
- Fibonacci
- RSI
- Gann
- ADXR
- Stochastics
- Volume
- Triangles
- Futures
- Cycles
- Volatility
- ZIGZAG
- MESA
- Retracement
- Aroon
INDICATORS LIST
LIST OF TOPICS
PRINT THIS ARTICLE
by Billy Williams
Explosive breakouts can occur from price channels if you understand how to spot them and use them.
Position: Hold
Billy Williams
Billy Williams has been trading the markets for 27 years, specializing in momentum trading with stocks and options.
PRINT THIS ARTICLE
TECHNICAL ANALYSIS
Spotting Breakouts From Price Channels
10/11/10 10:31:44 AMby Billy Williams
Explosive breakouts can occur from price channels if you understand how to spot them and use them.
Position: Hold
| Moving up and down like waves that are moving back and forth in the tide, a stock's price movement begins to settle into the ebb and flow of buying and selling, forming price channels. Price channels establish clear lines of support and resistance either at an angle in the trajectory in the movement of the stock's price action or horizontally in the stock's price action. These areas form levels of support and resistance but also serve as the staging ground for breakouts to occur, and being aware of them can help you latch onto an explosive move, profiting handsomely but difficult to spot the precise entry, especially if the price channel is trading at an angle. Price channels form when there are not enough buyers or sellers in sufficient number to take control of the direction of a given stock. Typically, this pattern will form after a significant runup, or fall, in the stock's price or if the market's sentiment toward a stock is in doubt. |

|
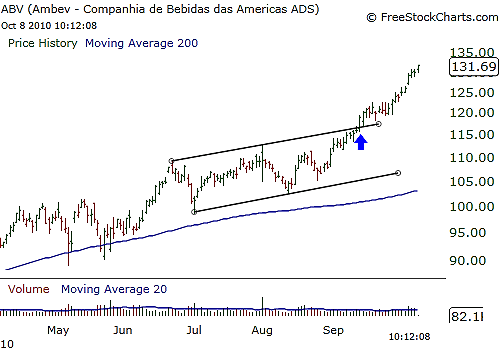
| FIGURE 1: ABV. ABV's price action forms a clear upward price channel until a breakout from the upper resistance level is triggered as buyers take control of the trend. |
| Graphic provided by: www.freestockcharts.com. |
| |
| For example, when a stock is hot news on Wall Street and Jim Cramer is screaming about its stock signal on his show, you can observe trading volume surging daily as new buyers enter the market to gobble up the stock. But as soon as there is a news release where the company announces good earnings but just not as good as was hoped by the stock's followers, the uptrend begins to stall and, possibly, decline in price. See Figure 1. Conversely, a pharmaceutical company's stock may oscillate back and forth in a downward price channel for months or even years, but as soon as the company announces a breakthrough drug that has just been FDA approved, the stock's price explodes upward into a new bullish trend. Knowing where to enter as price is breaking free of a price channel gives you another tool to be able to catch an explosive trend emerging from a channel. |

|
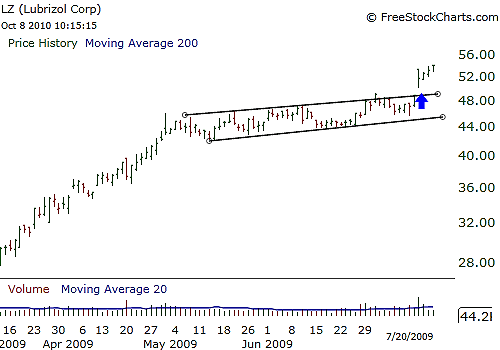
| FIGURE 2: LZ. LZ trades within a tight price channel, offering a false breakout followed by a real breakout that trades above the former high of the last breakout attempt. |
| Graphic provided by: www.freestockcharts.com. |
| |
| Look for a price channel that has been consolidating for some time, typically eight weeks, give or take, and identify the trajectory of the price action. For a channel that is at an upward angle, draw a trendline between two price lows and then create a parallel line for the price level right above it. Set the new parallel trendline above the price channel, trying to connect at least two price points in order to identify the resistance level for the channel. These two lines now offer visual representation of a upper price channel. Look for price to trade upward and through the upper resistance level on higher volume, revealing that buyers have taken control of the stock's trend, entering on the breakout. See Figure 2. |

|
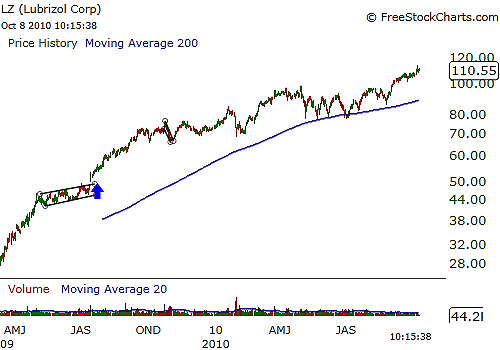
| FIGURE 3: LZ. LZ goes on to more than double in price with its bullish trend firmly in place since its breakout from its channel pattern. |
| Graphic provided by: www.freestockcharts.com. |
| |
| If the breakout should fail and price retreats back into the price channel pattern, then wait for a second entry. If price breaks out again, trading through the resistance level, then wait for it to trade past the high set in the price action by the false breakout to ensure it is following through this time. See Figure 3. |
Billy Williams has been trading the markets for 27 years, specializing in momentum trading with stocks and options.
| Company: | StockOptionSystem.com |
| E-mail address: | stockoptionsystem.com@gmail.com |
Traders' Resource Links | |
| StockOptionSystem.com has not added any product or service information to TRADERS' RESOURCE. | |
Click here for more information about our publications!
Comments

Request Information From Our Sponsors
- StockCharts.com, Inc.
- Candle Patterns
- Candlestick Charting Explained
- Intermarket Technical Analysis
- John Murphy on Chart Analysis
- John Murphy's Chart Pattern Recognition
- John Murphy's Market Message
- MurphyExplainsMarketAnalysis-Intermarket Analysis
- MurphyExplainsMarketAnalysis-Visual Analysis
- StockCharts.com
- Technical Analysis of the Financial Markets
- The Visual Investor
- VectorVest, Inc.
- Executive Premier Workshop
- One-Day Options Course
- OptionsPro
- Retirement Income Workshop
- Sure-Fire Trading Systems (VectorVest, Inc.)
- Trading as a Business Workshop
- VectorVest 7 EOD
- VectorVest 7 RealTime/IntraDay
- VectorVest AutoTester
- VectorVest Educational Services
- VectorVest OnLine
- VectorVest Options Analyzer
- VectorVest ProGraphics v6.0
- VectorVest ProTrader 7
- VectorVest RealTime Derby Tool
- VectorVest Simulator
- VectorVest Variator
- VectorVest Watchdog
