HOT TOPICS LIST
- MACD
- Fibonacci
- RSI
- Gann
- ADXR
- Stochastics
- Volume
- Triangles
- Futures
- Cycles
- Volatility
- ZIGZAG
- MESA
- Retracement
- Aroon
INDICATORS LIST
LIST OF TOPICS
PRINT THIS ARTICLE
by Billy Williams
Learn how cup & handle patterns reveal explosive trade setups on a variety of time periods.
Position: Hold
Billy Williams
Billy Williams has been trading the markets for 27 years, specializing in momentum trading with stocks and options.
PRINT THIS ARTICLE
CUP WITH HANDLE
Use Different Time Frames To Spot Cup & Handle Patterns
10/11/10 09:36:52 AMby Billy Williams
Learn how cup & handle patterns reveal explosive trade setups on a variety of time periods.
Position: Hold
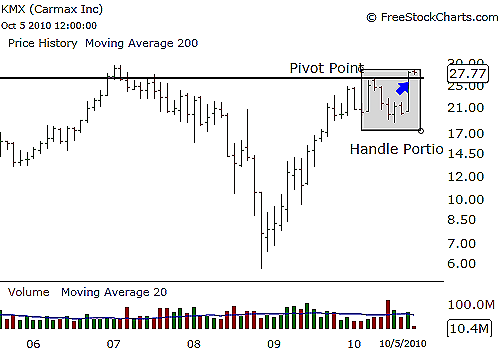
| Cup & handle patterns have proven over and over again to be the mother's milk of momentum trading due to the ability to time an effective entry. This pattern is one of the most common consolidation patterns, usually occurring after an extended move in price. Price action will move slowly down, then up in a U-shaped cup formation. Once the prior resistance level on the left side of the cup is met on the right side, prices will drift lower on decreasing volume until the upside breakout occurs. Upon this breakout, the success rate can be as high as 74% and even higher, up to 90%, if you wait for the entry's confirmation to the upside as it price trades up through the pivot point set at the high of the handle portion of the chart pattern. This pattern typically takes at least seven weeks to form but can take over a year to fully form as well as appear on different time frames. This is why it's important to look at several different times frames (that is, daily, weekly, and monthly charts) to identify a cup & handle pattern that is forming in order to find low-risk entry points. So, by scanning differing chart settings as well as a variety of stocks, you spot a higher number of high probability setups. See Figure 1. |

|
| FIGURE 1: KMX, FIVE YEARS. KMX reveals a cup & handle pattern on the weekly chart pattern over five years' worth of price data. |
| Graphic provided by: www.freestockcharts.com. |
| |
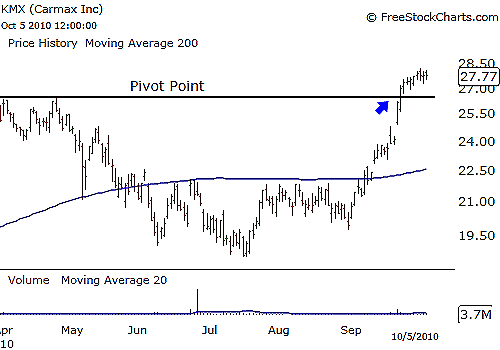
| The handle portion of the pattern takes at least a week to form but can take longer depending on the time frame, so be sure to adjust your outlook for its formation, depending on the period of time that is reflected on your chart. Volume will follow the cup portion of the pattern and decline within the handle portion. Look for volume to confirm the entry point above the high set in the handle portion, with an increase of 150% a good sign that the stock's price action will follow through, exploding upward and increasing in price. Be careful, though: If the cup is too steep because it can fail to create enough of an ownership base on the big investor's behalf such as mutual funds and institutional buyers, it could instead fall apart, creating another price pattern as a result. Handles should not decline from the cup pivot high, or resistance level, by more than 15% to 20% before attempting a breakout. See Figure 2. |

|
| FIGURE 2: KMX, SIX MONTHS. By dropping down to the daily six-month chart, you can time your entry into KMX within the handle portion of the pattern. |
| Graphic provided by: www.freestockcharts.com. |
| |
| When trading the pattern, be sure to identify this pivot high or resistance level within the handle because this will serve as your entry level and serve as the starting point for a potential bull run at this point. This is, in effect, Ground Zero for an explosive move to take the stock higher and yield huge gains, especially when confirmed with higher trade volume as the price bar trades up through this level. For short-term traders, the initial price target can be calculated as the depth of the cup to the upside past the cup resistance level, not the handle portion. In addition, cups with a higher right lip outperform those with a higher left lip. For those with a longer time frame for the duration of their trade, try to match the entry in the stock along with timing the market by waiting for a confirmation that the major indexes, such as the Standard & Poor's 500, will signal a bullish bias in their price movement. This ensures that you have the market behind the stock's upward movement at the point of entry and can ride the upward momentum until the overall market signals a decline, or correction, at which time you will exit at a higher price. |
Billy Williams has been trading the markets for 27 years, specializing in momentum trading with stocks and options.
| Company: | StockOptionSystem.com |
| E-mail address: | stockoptionsystem.com@gmail.com |
Traders' Resource Links | |
| StockOptionSystem.com has not added any product or service information to TRADERS' RESOURCE. | |
Click here for more information about our publications!
PRINT THIS ARTICLE

Request Information From Our Sponsors
- StockCharts.com, Inc.
- Candle Patterns
- Candlestick Charting Explained
- Intermarket Technical Analysis
- John Murphy on Chart Analysis
- John Murphy's Chart Pattern Recognition
- John Murphy's Market Message
- MurphyExplainsMarketAnalysis-Intermarket Analysis
- MurphyExplainsMarketAnalysis-Visual Analysis
- StockCharts.com
- Technical Analysis of the Financial Markets
- The Visual Investor
- VectorVest, Inc.
- Executive Premier Workshop
- One-Day Options Course
- OptionsPro
- Retirement Income Workshop
- Sure-Fire Trading Systems (VectorVest, Inc.)
- Trading as a Business Workshop
- VectorVest 7 EOD
- VectorVest 7 RealTime/IntraDay
- VectorVest AutoTester
- VectorVest Educational Services
- VectorVest OnLine
- VectorVest Options Analyzer
- VectorVest ProGraphics v6.0
- VectorVest ProTrader 7
- VectorVest RealTime Derby Tool
- VectorVest Simulator
- VectorVest Variator
- VectorVest Watchdog
