HOT TOPICS LIST
- MACD
- Fibonacci
- RSI
- Gann
- ADXR
- Stochastics
- Volume
- Triangles
- Futures
- Cycles
- Volatility
- ZIGZAG
- MESA
- Retracement
- Aroon
INDICATORS LIST
LIST OF TOPICS
PRINT THIS ARTICLE
by Chaitali Mohile
Head & shoulders patterns have become a common sight on the technical charts of stocks and indexes. But the path prices take can differ.
Position: N/A
Chaitali Mohile
Active trader in the Indian stock markets since 2003 and a full-time writer. Trading is largely based upon technical analysis.
PRINT THIS ARTICLE
HEAD & SHOULDERS
XLE Breaks Out
10/11/10 01:57:08 PMby Chaitali Mohile
Head & shoulders patterns have become a common sight on the technical charts of stocks and indexes. But the path prices take can differ.
Position: N/A
| A head & shoulders or an inverted head & shoulders pattern is considered to be one of the most reliable patterns. The breakouts of these formations indicate major trend reversals. These formations seem to be occuring frequently on technical charts. Does this mean they are likely to lose their importance in current circumstances? |
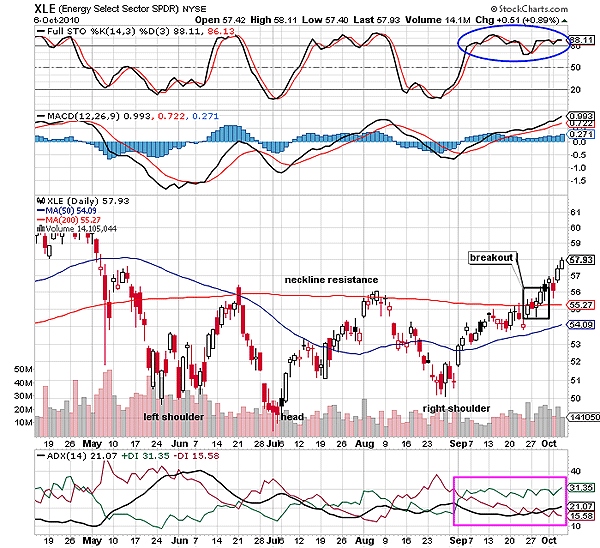
| The Energy Select Sector SPDR (XLE) has formed a short-term inverted head & shoulders formation (Figure 1). This formation breaks upward as it is a bullish trend reversal formation. A downtrend, as reflected by the average directional index (ADX) (14) was overheated, while the left shoulder and head were being built. Gradually, the downtrend plunged, confirming the trend reversal pattern. Buying volume increased as the right shoulder was formed, highlighting the developing demand for XLE. |

|
| FIGURE 1: XLE, DAILY. An inverted head & shoulder breakout rally has established support on the 200-day MA neckline. |
| Graphic provided by: StockCharts.com. |
| |
| The moving average convergence/divergence (MACD) (12,26,9) has surged into positive territory by forming higher lows indicating bullish momentum in the pattern. XLE has recently witnessed a breakout and has established fresh support on the 200-day MA. The breakout is confirmed by the developing uptrend in Figure 1. In addition, the full stochastic (14,3,3) is highly overbought, so price can marginally retrace if the indicator slips a bit. However, XLE has the support of the 200-day MA at $55, so the bullish momentum would sustain for as long as XLE stays above this support. 55 - 49 = 6 + 55 = 61, which is the minimum estimated level for the breakout rally. |

|
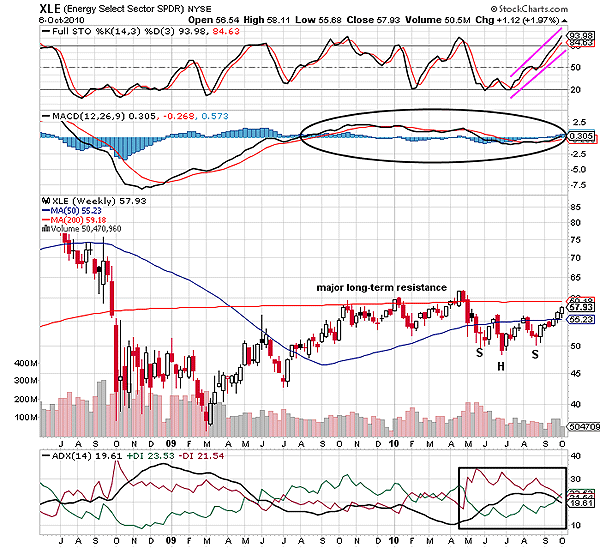
| FIGURE 2: XLE, WEEKLY. The short-term inverted head & shoulder has the 50-day MA neckline resistance. The breakout rally is likely to move sideways due to the 200-day MA resistance. |
| Graphic provided by: StockCharts.com. |
| |
| On the weekly time frame in Figure 2 you also see the short-term inverted head & shoulders pattern. The 50-day MA acts as a resistance level. The 200-day MA has been the major long-term resistance for XLE. The sector index has tumbled many times after hitting the MA resistance. Although the potential target of XLE is $61, the MA resistance is much closer to the targeted level. Therefore, traders must stay watchful during the breakout rally. The ADX (14) is currently showing a weak trend, but for a stable breakout rally, the indicator has to surge above 20 levels. The MACD (12,26,9) shows significant volatility and the stochastic oscillator has steeply climbed to a highly overbought level. In such a scenario XLE is likely to remain range-bound between 200 and 50-day MAs, thus restricting the breakout rally. |
| Here, we can see the breakout conditions of the inverted head & shoulders pattern for XLE are not technically sound. Though the pattern is one of the strongest, the conditions on the charts differ; some allow the rally to proceed smoothly while some meet various hurdles along the way. |
Active trader in the Indian stock markets since 2003 and a full-time writer. Trading is largely based upon technical analysis.
| Company: | Independent |
| Address: | C1/3 Parth Indraprasth Towers. Vastrapur |
| Ahmedabad, Guj 380015 | |
| E-mail address: | chaitalimohile@yahoo.co.in |
Traders' Resource Links | |
| Independent has not added any product or service information to TRADERS' RESOURCE. | |
Click here for more information about our publications!
PRINT THIS ARTICLE

Request Information From Our Sponsors
- StockCharts.com, Inc.
- Candle Patterns
- Candlestick Charting Explained
- Intermarket Technical Analysis
- John Murphy on Chart Analysis
- John Murphy's Chart Pattern Recognition
- John Murphy's Market Message
- MurphyExplainsMarketAnalysis-Intermarket Analysis
- MurphyExplainsMarketAnalysis-Visual Analysis
- StockCharts.com
- Technical Analysis of the Financial Markets
- The Visual Investor
- VectorVest, Inc.
- Executive Premier Workshop
- One-Day Options Course
- OptionsPro
- Retirement Income Workshop
- Sure-Fire Trading Systems (VectorVest, Inc.)
- Trading as a Business Workshop
- VectorVest 7 EOD
- VectorVest 7 RealTime/IntraDay
- VectorVest AutoTester
- VectorVest Educational Services
- VectorVest OnLine
- VectorVest Options Analyzer
- VectorVest ProGraphics v6.0
- VectorVest ProTrader 7
- VectorVest RealTime Derby Tool
- VectorVest Simulator
- VectorVest Variator
- VectorVest Watchdog
