HOT TOPICS LIST
- MACD
- Fibonacci
- RSI
- Gann
- ADXR
- Stochastics
- Volume
- Triangles
- Futures
- Cycles
- Volatility
- ZIGZAG
- MESA
- Retracement
- Aroon
INDICATORS LIST
LIST OF TOPICS
PRINT THIS ARTICLE
by Koos van der Merwe
Wherever I look, I see this pattern on shares. Is it a pattern that can be ignored?
Position: Buy
Koos van der Merwe
Has been a technical analyst since 1969, and has worked as a futures and options trader with First Financial Futures in Johannesburg, South Africa.
PRINT THIS ARTICLE
HEAD & SHOULDERS
Inverted Head & Shoulders. Should We Be Jumping For Joy?
10/06/10 09:06:25 AMby Koos van der Merwe
Wherever I look, I see this pattern on shares. Is it a pattern that can be ignored?
Position: Buy
| Can we ignore this pattern when we see it? I don't believe so. History has shown that the target suggested by the inverse head & shoulders pattern, like its counterpart, the head & shoulders pattern, is one that should not be ignored. The targets suggested are very real and are hit more often than not. Let us look at a typical H&S pattern, which most traders accept without argument. |

|
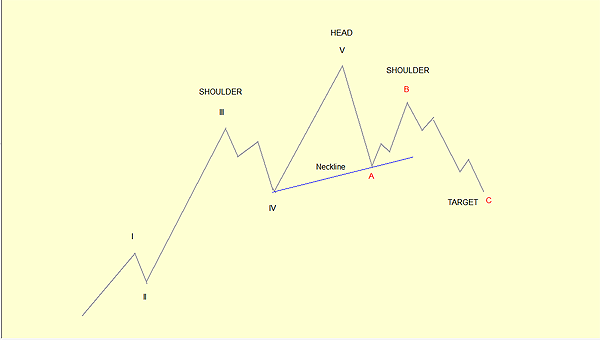
| FIGURE 1: HEAD & SHOULDERS FORMATION RELATED TO ELLIOTT WAVE COUNT |
| Graphic provided by: AdvancedGET. |
| |
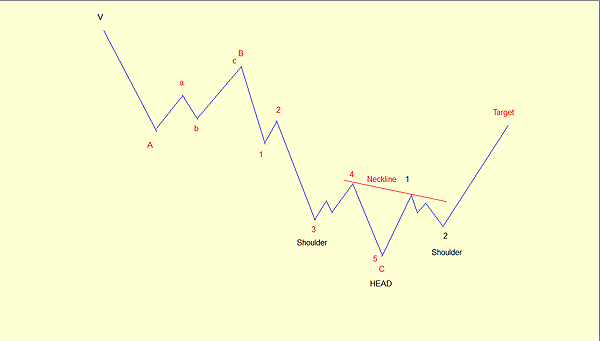
| Figure 1 shows how the head of a head & shoulders pattern is the top of Wave V, with Waves III and Wave B being both shoulders. This is accepted as the norm and always suggests a target. Elliott wave theory says that Wave C should be within the fourth Wave of lesser degree, whether it be the Grand Supercycle or a Sub-Minuette Cycle. The difficulty is reading the wave formation. See Figure 2. Now, the inverted head & shoulder pattern is simply the inverse of the H&S pattern. Of course, the wave count is different, but the result should be the same: a target that can be pretty accurate. |

|
| FIGURE 2: INVERTED HEAD & SHOULDERS PATTERN RELATED TO ELLIOTT WAVE COUNT |
| Graphic provided by: AdvancedGET. |
| |
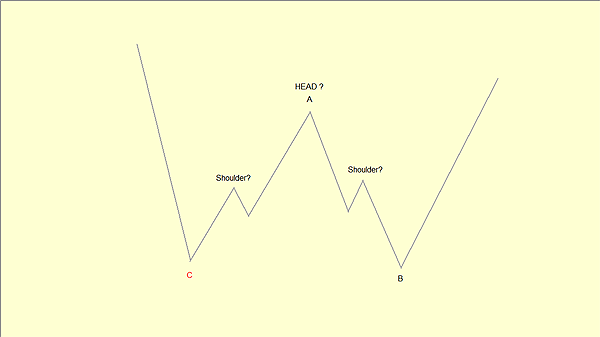
| R.N. Elliott did refer to a structure called an "A-B" base, in which after a decline had ended on a satisfactory count, the market advanced in three waves and then declined in three waves prior to the start of a new five-wave bull market as shown in Figure 3. |

|
| FIGURE 3: "W" BOTTOM AND AB BASE |
| Graphic provided by: AdvancedGET. |
| |
| Figure 3 shows a H&S failure at a market bottom. This suggests that an inverted H&S failure -- that is, an A-B count -- should not occur at a market bottom, but only at a market top. Any inverted H&S pattern that looks correct, especially when the neckline is broken by all accounts, should therefore be true. Arguments by bears to the contrary are suspect. With the above in mind, I offer a chart of a share with an inverted H&S pattern to be considered. |

|
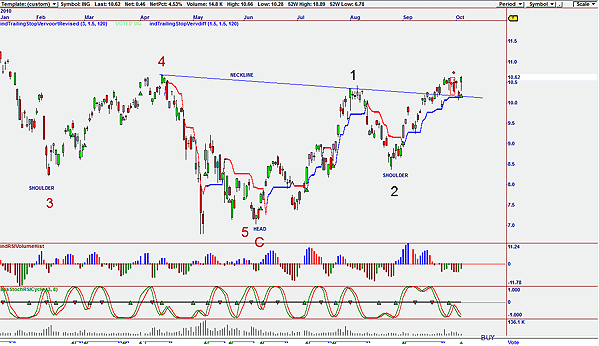
| FIGURE 4: ING, INVERTED HEAD & SHOULDERS PATTERN |
| Graphic provided by: OmniTrader. |
| |
| Figure 4, an inverted H&S pattern on the share ING, shows how the neckline has been penetrated and acts as a support level for a rise to the target, which you will have to calculate. But what about a "W" bottom? A "W" bottom only occurs when the shoulder shown as wave 2 on the chart falls to the same price level as Wave C. This formation negates any inverse H&S pattern. So look at all possible inverted H&S patterns with optimism, but wait for a break of the neckline before jumping for joy. |
Has been a technical analyst since 1969, and has worked as a futures and options trader with First Financial Futures in Johannesburg, South Africa.
| Address: | 3256 West 24th Ave |
| Vancouver, BC | |
| Phone # for sales: | 6042634214 |
| E-mail address: | petroosp@gmail.com |
Click here for more information about our publications!
Comments
Date: 10/13/10Rank: 5Comment: Hope all is well
Dick

Request Information From Our Sponsors
- StockCharts.com, Inc.
- Candle Patterns
- Candlestick Charting Explained
- Intermarket Technical Analysis
- John Murphy on Chart Analysis
- John Murphy's Chart Pattern Recognition
- John Murphy's Market Message
- MurphyExplainsMarketAnalysis-Intermarket Analysis
- MurphyExplainsMarketAnalysis-Visual Analysis
- StockCharts.com
- Technical Analysis of the Financial Markets
- The Visual Investor
- VectorVest, Inc.
- Executive Premier Workshop
- One-Day Options Course
- OptionsPro
- Retirement Income Workshop
- Sure-Fire Trading Systems (VectorVest, Inc.)
- Trading as a Business Workshop
- VectorVest 7 EOD
- VectorVest 7 RealTime/IntraDay
- VectorVest AutoTester
- VectorVest Educational Services
- VectorVest OnLine
- VectorVest Options Analyzer
- VectorVest ProGraphics v6.0
- VectorVest ProTrader 7
- VectorVest RealTime Derby Tool
- VectorVest Simulator
- VectorVest Variator
- VectorVest Watchdog
