

HOT TOPICS LIST
- MACD
- Fibonacci
- RSI
- Gann
- ADXR
- Stochastics
- Volume
- Triangles
- Futures
- Cycles
- Volatility
- ZIGZAG
- MESA
- Retracement
- Aroon
INDICATORS LIST
LIST OF TOPICS
PRINT THIS ARTICLE
by Koos van der Merwe
The easy credit given by the banks in the United States was the reason for the recent economic collapse. Canadian banks, however, fared far better.
Position: Buy
Koos van der Merwe
Has been a technical analyst since 1969, and has worked as a futures and options trader with First Financial Futures in Johannesburg, South Africa.
PRINT THIS ARTICLE
BREAKOUTS
Canadian Banks
10/04/10 10:15:23 AMby Koos van der Merwe
The easy credit given by the banks in the United States was the reason for the recent economic collapse. Canadian banks, however, fared far better.
Position: Buy
| When I was a young boy, banks were a place where you deposited your money rather than hide it under the mattress of your bed. They paid you interest on the money, and whenever you walked though their glass doors, you felt secure. Their biggest fear was a Bonnie and Clyde scenario, but they insured themselves against that, with independent insurance companies. Today, banks are banks, stockbrokers, traders in the futures and stock markets, insurance companies, hedge funds -- you name it: When it comes to money, banks are there. In the US and elsewhere in the world, all their alternate personalities are being dismantled. However, it's a different story in Canada. Banks still have a finger in every monetary pie simply because regulations are tighter. One of the Canadian banks that was hit badly, simply because they had branches and interests in the US, copying and taking an active part in the high-risk strategies that was the name of the game, was the Canadian Imperial Bank of Commerce (CIBC). |
|
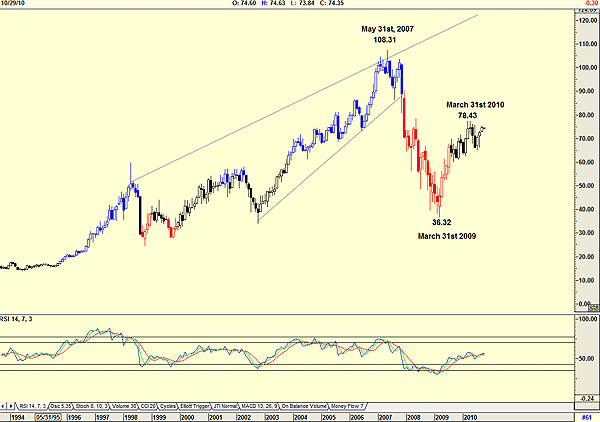
| FIGURE 1: CIBC, MONTHLY |
| Graphic provided by: AdvancedGET. |
| |
| Figure 1, a monthly chart, shows how the price fell from a high of $108.31 on May 31, 2007, to $36.32 by March 31, 2009, a drop of 66.47%. There must have been a lot of very unhappy long-term investors. Since then, it has recovered more than 50% of that fall to reach a high of $78.43 by March 31, 2010. The relative strength index (RSI) is suggesting that the trend is up. |
|
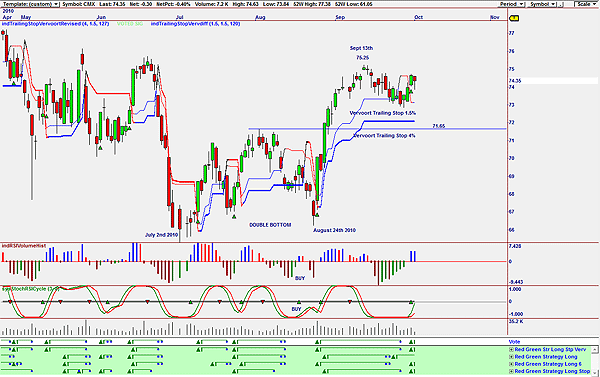
| FIGURE 2: CIBC, DAILY |
| Graphic provided by: OmniTrader. |
| |
| Looking at a daily chart (Figure 2), we can see how the share price formed a double bottom on July 2 and August 24 before moving up strongly to break the resistance level at $71.65. Both the RSI volume histogram indicator and the stochastic RSI cycle indicator gave buys a little too early. However, the red/green strategies gave buys as the share price moved up strongly as shown by the vote line. We could use the signals given by the indicators as a shout to WATCH ME! with confirmation by the red/green strategy. Note that after reaching the high of $75.25 by September 13, the price fell below the Vervoort 1.5% trailing stop, suggesting a sell, but did not fall below the 4% Vervoort trailing stop, suggesting a long-term hold was still in force. This has been confirmed by the new buy signal given on the vote line. I would be a buyer of CIBC bank on the Canadian stock exchange. The share is paying a 4.7% yield at current prices, which is an attractive additional incentive. |
Has been a technical analyst since 1969, and has worked as a futures and options trader with First Financial Futures in Johannesburg, South Africa.
| Address: | 3256 West 24th Ave |
| Vancouver, BC | |
| Phone # for sales: | 6042634214 |
| E-mail address: | petroosp@gmail.com |
Click here for more information about our publications!
PRINT THIS ARTICLE

Request Information From Our Sponsors
- StockCharts.com, Inc.
- Candle Patterns
- Candlestick Charting Explained
- Intermarket Technical Analysis
- John Murphy on Chart Analysis
- John Murphy's Chart Pattern Recognition
- John Murphy's Market Message
- MurphyExplainsMarketAnalysis-Intermarket Analysis
- MurphyExplainsMarketAnalysis-Visual Analysis
- StockCharts.com
- Technical Analysis of the Financial Markets
- The Visual Investor
- VectorVest, Inc.
- Executive Premier Workshop
- One-Day Options Course
- OptionsPro
- Retirement Income Workshop
- Sure-Fire Trading Systems (VectorVest, Inc.)
- Trading as a Business Workshop
- VectorVest 7 EOD
- VectorVest 7 RealTime/IntraDay
- VectorVest AutoTester
- VectorVest Educational Services
- VectorVest OnLine
- VectorVest Options Analyzer
- VectorVest ProGraphics v6.0
- VectorVest ProTrader 7
- VectorVest RealTime Derby Tool
- VectorVest Simulator
- VectorVest Variator
- VectorVest Watchdog