

HOT TOPICS LIST
- MACD
- Fibonacci
- RSI
- Gann
- ADXR
- Stochastics
- Volume
- Triangles
- Futures
- Cycles
- Volatility
- ZIGZAG
- MESA
- Retracement
- Aroon
INDICATORS LIST
LIST OF TOPICS
PRINT THIS ARTICLE
by Donald W. Pendergast, Jr.
Metals -- are they at some sort of a top, or are they destined to run still higher through year-end? No one really knows, but right now, silver futures and gold equities are substantially outperforming gold futures.
Position: N/A
Donald W. Pendergast, Jr.
Donald W. Pendergast is a financial markets consultant who offers specialized services to stock brokers and high net worth individuals who seek a better bottom line for their portfolios.
PRINT THIS ARTICLE
REL. STR COMPARATIVE
Gold Stocks And Silver Outperforming Gold
10/04/10 09:40:57 AMby Donald W. Pendergast, Jr.
Metals -- are they at some sort of a top, or are they destined to run still higher through year-end? No one really knows, but right now, silver futures and gold equities are substantially outperforming gold futures.
Position: N/A
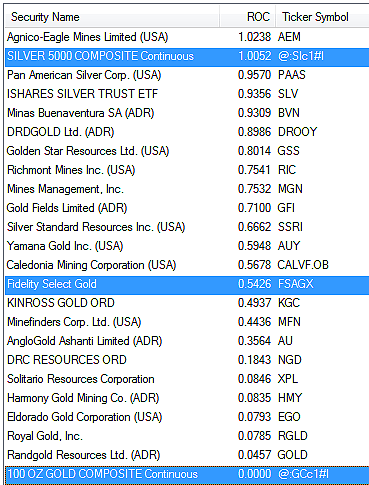
| As impressive as the recent 23-month bull run in gold has been (up by 92% since bottoming at $681 in October 2008), silver has gold beat, hands down, rising an astounding 148% during the same period. Even more impressive, the Fidelity Select Sector gold mutual fund (FSAGX) has clobbered both precious metals over the exact same timespan, rising by more than 218% in a little over 23 months. Hmm ... maybe buy & hold isn't as dead a strategy as we thought! See Figure 1. |
|
| FIGURE 1: SILVER AND GOLD. Interesting -- Agnico-Eagle Mines (AEM) has greatly outperformed its parent sector mutual fund (Fidelity Select Gold, FSAGX), even as silver futures (SI) have far outpaced the performance of gold futures (GC) over the past 13 weeks. Over the past 23 months, however, FSAGX offered far superior performance to that of silver and gold futures. |
| Graphic provided by: MetaStock. |
| Graphic provided by: Metastock's Explorer. |
| |
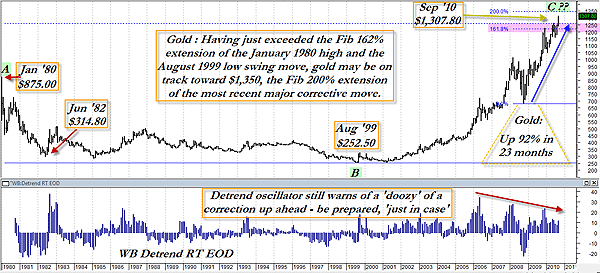
| Very impressive trends all, and worthy of respect by serious traders and investors. But now let's look at the monthly gold futures (continuous data) contract in Figure 2 and put at least one of the aforementioned trends in better context. On the far left side of the chart is the January 1980 monthly price bar -- the one that opened at $562.50 and then proceeded to spike to $875 only three weeks later. Just three days later after reaching the all-time high of $875, gold closed out the week at $634, a drop of nearly 28% in three trading days! And nine weeks later, gold closed at only $509 -- after dipping as low as $453. Granted, gold ran from about $35 an ounce in August 1971 (when President Richard Nixon closed the gold "window" (in effect telling French president Charles DeGaulle to take a hike back across the pond, along with his country's big pile of rapidly depreciating US dollars -- DeGaulle had wished to exercise his right to exchange France's holdings of US currency and debt instruments for physical gold -- as the law plainly stated was his right, by the way) up to $875 in a little over eight years, so gold at $509 was still pretty impressive, unless you were the dude who mortgaged the farm to buy bags of gold coins and bullion in the $700+ area. Don't forget, even back then there were several (names withheld to protect the guilty) high-profile gold bugs who were pounding the table for $2,000 and even $3,000 gold prices. (Gold from $35 in 1971 to $3,000 by 1982. You bet.) Right now, gold, silver and precious metals stocks are red hot, but stop and consider your exit strategy now, especially if you have substantial holdings of either metal. If you're long significant numbers of futures contracts, be aware that gold and silver are likely to correct dramatically (and without much warning), right after the next significant top is reached. For now, be on the lookout for $1,350 to be one possible pause/and or profit-taking area, as gold will have risen nearly 100% from its October 2008 crash low at that price zone. The detrend oscillator is still flashing a very pronounced bearish divergence signal, one that will eventually play out, probably much to the surprise of the flood of latecomers to this red-hot metals commodity market. Play the gold and silver market with great wisdom -- by all means, make the most of the bullish seasonal pattern that may take both metals higher, but also make sure that you have sure-fire exit strategy in place so you don't get caught in the crossfire of a shootout between the bulls and bears at such lofty (and perhaps short-lived) price zones between $1,350 to $1,500 an ounce. |
|
| FIGURE 2: GOLD. Gold is still going strong, but the detrend oscillator still warns of a significant correction to come, timing as yet uncertain. Look at the correction/trend reversal in gold that occurred between January 1980 and June 1982 for a possible hint as to what lies ahead once the global commodity bubble finally implodes. |
| Graphic provided by: MetaStock. |
| Graphic provided by: WB: Detrend RT EOD from MetaStock v.11. |
| |
Donald W. Pendergast is a financial markets consultant who offers specialized services to stock brokers and high net worth individuals who seek a better bottom line for their portfolios.
| Title: | Writer, market consultant |
| Company: | Linear Trading Systems LLC |
| Jacksonville, FL 32217 | |
| Phone # for sales: | 904-239-9564 |
| E-mail address: | lineartradingsys@gmail.com |
Traders' Resource Links | |
| Linear Trading Systems LLC has not added any product or service information to TRADERS' RESOURCE. | |
Click here for more information about our publications!
Comments

Request Information From Our Sponsors
- StockCharts.com, Inc.
- Candle Patterns
- Candlestick Charting Explained
- Intermarket Technical Analysis
- John Murphy on Chart Analysis
- John Murphy's Chart Pattern Recognition
- John Murphy's Market Message
- MurphyExplainsMarketAnalysis-Intermarket Analysis
- MurphyExplainsMarketAnalysis-Visual Analysis
- StockCharts.com
- Technical Analysis of the Financial Markets
- The Visual Investor
- VectorVest, Inc.
- Executive Premier Workshop
- One-Day Options Course
- OptionsPro
- Retirement Income Workshop
- Sure-Fire Trading Systems (VectorVest, Inc.)
- Trading as a Business Workshop
- VectorVest 7 EOD
- VectorVest 7 RealTime/IntraDay
- VectorVest AutoTester
- VectorVest Educational Services
- VectorVest OnLine
- VectorVest Options Analyzer
- VectorVest ProGraphics v6.0
- VectorVest ProTrader 7
- VectorVest RealTime Derby Tool
- VectorVest Simulator
- VectorVest Variator
- VectorVest Watchdog