HOT TOPICS LIST
- MACD
- Fibonacci
- RSI
- Gann
- ADXR
- Stochastics
- Volume
- Triangles
- Futures
- Cycles
- Volatility
- ZIGZAG
- MESA
- Retracement
- Aroon
INDICATORS LIST
LIST OF TOPICS
PRINT THIS ARTICLE
by Chaitali Mohile
IBM was consolidating for quite a while. The long-term charts of the stock look healthy and bullish.
Position: Buy
Chaitali Mohile
Active trader in the Indian stock markets since 2003 and a full-time writer. Trading is largely based upon technical analysis.
PRINT THIS ARTICLE
BREAKOUTS
IBM At All-Time High
09/30/10 02:56:35 PMby Chaitali Mohile
IBM was consolidating for quite a while. The long-term charts of the stock look healthy and bullish.
Position: Buy
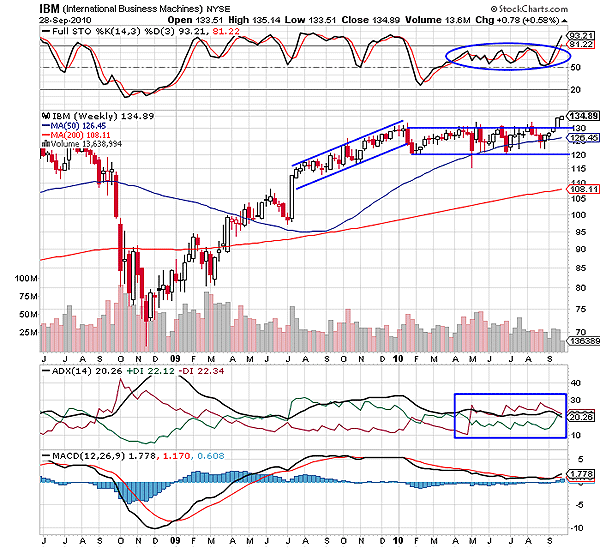
| After ascending for six months in 2009, International Business Machines (IBM) entered a sideways consolidation in the $130 to $120 range. During consolidation, IBM maintained its bullishness by sustaining support at $120. The momentum indicators in Figure 1, the full stochastic (14,3,3) and the moving average convergence/divergence (MACD) (12,26,9), were bullish as they established support on the 50 levels and the zero line, respectively. Although the bullish consolidation was somewhat volatile, IBM moved in a clear horizontal channel. Since the consolidation period of the stock is more than six months, it is considered to be a long-term consolidation. |

|
| FIGURE 1: IBM, WEEKLY |
| Graphic provided by: StockCharts.com. |
| |
| Generally, the stock loses its grip on the trend as well as momentum if the consolidation lasts for a while. In Figure 1, we can see a developing uptrend of the average directional index (ADX) (14) reversed to a bearish trend during the sideways action. Though the MACD (12,26,9) and stochastic oscillator sustained in the bullish zone, they frequently changed directions, indicating volatile momentum in the rally. However, the current bullish wave in the financial markets helped IBM to break upward. This bullish breakout offers an excellent buying opportunity for traders as well as long-term investors. The stochastic confirmed the fresh buying at current levels by surging with the support of the center line (50 levels). |
| The breakout has pulled IBM to new highs at $134. The stock looks bullish at these higher levels, and therefore, the breakout rally is likely to continue its journey on the bullish track. |

|
| FIGURE 2: IBM, MONTHLY |
| Graphic provided by: StockCharts.com. |
| |
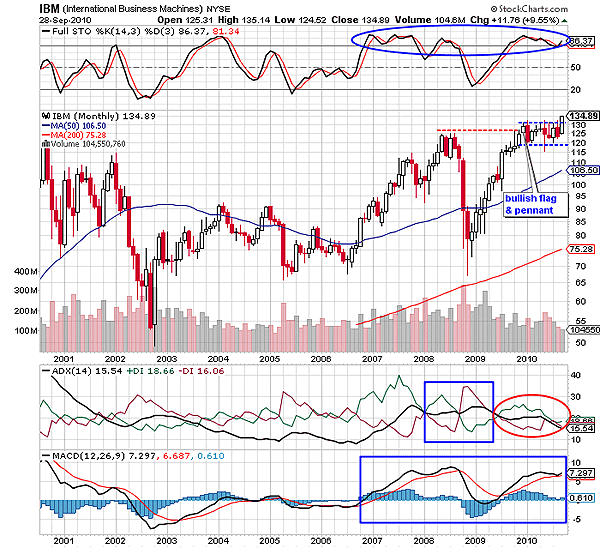
| In 2008, IBM witnessed a major correction, losing almost 50% of its stock value. The stock plunged to the previous low support at $70. The negative divergence of the full stochastic (14,3,3) was one of the technical reasons for the correction in Figure 2. Meanwhile, the long-term uptrend reversed to the downtrend. But the pullback rally began before the downtrend could develop stronger. Once more the bulls took the charge of the rally and rushed higher, violating the previous high resistance at $125. The stock immediately consolidated with newly formed support. The MACD (12,26,9) was the only indicator in Figure 2 that sustained in the bullish region, even during the corrective phase of IBM. The consolidation at the new high strengthened the bullish momentum. |
| The stochastic (14,3,3) traveled from the oversold to overbought region during the relief rally in Figure 2. The consolidation formed a bullish flag & pennant formation on the monthly time in Figure 2. The bullish continuation pattern of IBM is ready to break upward. The bullish breakout on the monthly time frame is itself a major event for any stock or index since the rally triggers fresh demand. Therefore, IBM is likely to move higher from the breakout levels. Traders can open fresh long positions from the new high of $134 with the potential target of $130 - 75 = 55 + 134 = $189. Thus, IBM looks healthy at current levels and should continue its bullish breakout move. |
Active trader in the Indian stock markets since 2003 and a full-time writer. Trading is largely based upon technical analysis.
| Company: | Independent |
| Address: | C1/3 Parth Indraprasth Towers. Vastrapur |
| Ahmedabad, Guj 380015 | |
| E-mail address: | chaitalimohile@yahoo.co.in |
Traders' Resource Links | |
| Independent has not added any product or service information to TRADERS' RESOURCE. | |
Click here for more information about our publications!
PRINT THIS ARTICLE

Request Information From Our Sponsors
- StockCharts.com, Inc.
- Candle Patterns
- Candlestick Charting Explained
- Intermarket Technical Analysis
- John Murphy on Chart Analysis
- John Murphy's Chart Pattern Recognition
- John Murphy's Market Message
- MurphyExplainsMarketAnalysis-Intermarket Analysis
- MurphyExplainsMarketAnalysis-Visual Analysis
- StockCharts.com
- Technical Analysis of the Financial Markets
- The Visual Investor
- VectorVest, Inc.
- Executive Premier Workshop
- One-Day Options Course
- OptionsPro
- Retirement Income Workshop
- Sure-Fire Trading Systems (VectorVest, Inc.)
- Trading as a Business Workshop
- VectorVest 7 EOD
- VectorVest 7 RealTime/IntraDay
- VectorVest AutoTester
- VectorVest Educational Services
- VectorVest OnLine
- VectorVest Options Analyzer
- VectorVest ProGraphics v6.0
- VectorVest ProTrader 7
- VectorVest RealTime Derby Tool
- VectorVest Simulator
- VectorVest Variator
- VectorVest Watchdog
