HOT TOPICS LIST
- MACD
- Fibonacci
- RSI
- Gann
- ADXR
- Stochastics
- Volume
- Triangles
- Futures
- Cycles
- Volatility
- ZIGZAG
- MESA
- Retracement
- Aroon
INDICATORS LIST
LIST OF TOPICS
PRINT THIS ARTICLE
by Koos van der Merwe
CNBC's Maria Bartiromo interviewed Robert Prechter of Elliott wave fame, and the Dow fell. Coincidence?
Position: Hold
Koos van der Merwe
Has been a technical analyst since 1969, and has worked as a futures and options trader with First Financial Futures in Johannesburg, South Africa.
PRINT THIS ARTICLE
ELLIOTT WAVE
That Big Bad Bear Shows Its Face
09/29/10 08:37:56 AMby Koos van der Merwe
CNBC's Maria Bartiromo interviewed Robert Prechter of Elliott wave fame, and the Dow fell. Coincidence?
Position: Hold
| Robert Prechter is editor of The Elliott Wave Theorist, the well-known newsletter that forecasts the movement of the Dow Jones Industrial Average (DJIA) and other indexes using Elliott wave theory. Early in February 2010, the veteran market watcher told the Society of Technical Analysts in London that a "grand, super-cycle top" is at hand. In the interview on September 27 with Maria Bartiromo on CNBC, he predicted that the DJIA would collapse to the 1000 level over the next few years. |

|
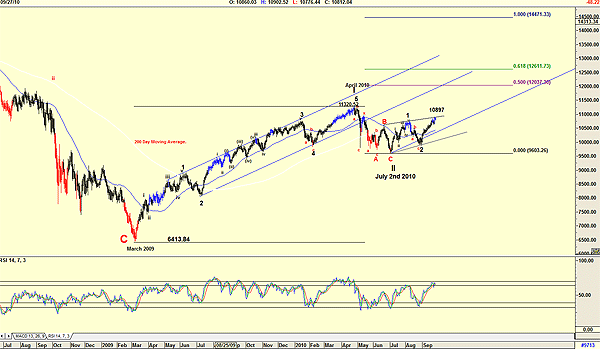
| FIGURE 1: DJIA, DAILY. DJIA shows a bullish wave count. |
| Graphic provided by: AdvancedGET. |
| |
| Studying the monthly chart of the DJIA, I can see where and why he arrived at this figure. However, Prechter may have forgotten what he taught me in the early 1980s, namely that the Elliott wave theory is a signpost, and the signs can change just a short way down the road. Believing that black is black and white is white and that there are no shades of gray does not work in the stock market. The stock market is managed by emotion, and we all know how emotion shifts and turns like the tides of the ocean. Figure 1, a daily chart of the DJIA, shows the following. In March 2009, from a C-Wave bottom at 6413.84, the DJIA moved above the 200-day moving average to form Wave I at 11320.52 by April 2010. From here it fell to 9603.26 by July 2 to form what could be a Wave II. "Could be" because the ABC correction of Wave II does not follow the first rule of the Elliott wave principle, namely, the wave must look right. The rise to 10897 could well be a B-Wave, with the C-Wave still to follow as shown by Figure 2. The chart then suggests a Wave III of 14471.33, the level where Wave III would be equal to Wave I as shown by the Fibonacci extension indicator. |

|
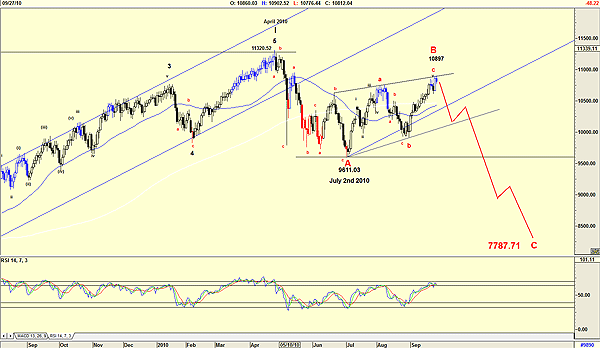
| FIGURE 2: DJIA, MONTHLY. Here, the DJIA is showing a short-term bearish count. |
| Graphic provided by: AdvancedGET. |
| |
| Figure 2 suggests that the target for Wave C could well be a 72% retracement of Wave I, namely 7787.71 (11320.52 - 6413.84 = 4906.68 x 0.72 = 3532.81; 1320.52 - 3532.81 = 7787.71). The relative strength index (RSI) is suggesting that the DJIA should correct. The 72% correction for the Wave II is not cast in stone, however, but it is a very rare occasion when a wave 2 corrects greater than a 72% retracement level. Yet Robert Prechter could be correct. The DJIA could well be in for another correction down, but his target of Dow 1000 does not seem likely. |
Has been a technical analyst since 1969, and has worked as a futures and options trader with First Financial Futures in Johannesburg, South Africa.
| Address: | 3256 West 24th Ave |
| Vancouver, BC | |
| Phone # for sales: | 6042634214 |
| E-mail address: | petroosp@gmail.com |
Click here for more information about our publications!
PRINT THIS ARTICLE

Request Information From Our Sponsors
- StockCharts.com, Inc.
- Candle Patterns
- Candlestick Charting Explained
- Intermarket Technical Analysis
- John Murphy on Chart Analysis
- John Murphy's Chart Pattern Recognition
- John Murphy's Market Message
- MurphyExplainsMarketAnalysis-Intermarket Analysis
- MurphyExplainsMarketAnalysis-Visual Analysis
- StockCharts.com
- Technical Analysis of the Financial Markets
- The Visual Investor
- VectorVest, Inc.
- Executive Premier Workshop
- One-Day Options Course
- OptionsPro
- Retirement Income Workshop
- Sure-Fire Trading Systems (VectorVest, Inc.)
- Trading as a Business Workshop
- VectorVest 7 EOD
- VectorVest 7 RealTime/IntraDay
- VectorVest AutoTester
- VectorVest Educational Services
- VectorVest OnLine
- VectorVest Options Analyzer
- VectorVest ProGraphics v6.0
- VectorVest ProTrader 7
- VectorVest RealTime Derby Tool
- VectorVest Simulator
- VectorVest Variator
- VectorVest Watchdog
