HOT TOPICS LIST
- MACD
- Fibonacci
- RSI
- Gann
- ADXR
- Stochastics
- Volume
- Triangles
- Futures
- Cycles
- Volatility
- ZIGZAG
- MESA
- Retracement
- Aroon
INDICATORS LIST
LIST OF TOPICS
PRINT THIS ARTICLE
by David Penn
Reduced spending by the Calpines and Enrons is bad news for power plant construction and service companies like Fluor.
Position: N/A
David Penn
Technical Writer for Technical Analysis of STOCKS & COMMODITIES magazine, Working-Money.com, and Traders.com Advantage.
PRINT THIS ARTICLE
DESCENDING TRIANGLES
Fluor's Descending Triangle
01/21/02 01:16:24 PMby David Penn
Reduced spending by the Calpines and Enrons is bad news for power plant construction and service companies like Fluor.
Position: N/A
| Given the short signal issued by the QQQs on December 14th (see "Zweig's Four Percent Solution", January 14, 2002, Traders Advantage) and the stubbornly enduring long signal in the DIA from October 8th, I have been paying more attention to short opportunities among the Nasdaq 100 stocks than anywhere else. However the disappointing earnings and likely resumption of the primary bear market trend have widespread effects not limited to the companies of the Nasdaq 100. |
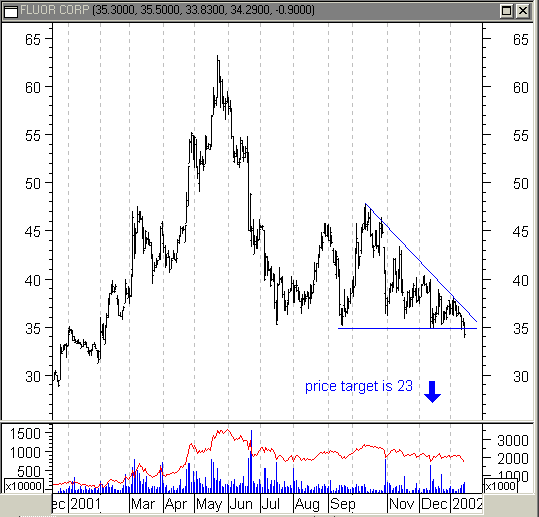
| One example of this is Fluor Corporation. Fluor (FLR) has been in a significant downtrend since May 2001. The stock fell from about 63 to establish a bottom just north of 35 in July. After a short, sharp rally, that bottom was again tested in September. In fact, the rally from the successful test took FLR up to about 47, somewhat higher than the rally that followed the initial July 2001 bottom. Unfortunately for Fluor bulls, prices began retreating immediately from the intermediate October peak, establishing a series of lower highs while at the same time finding solid resistance at 35. |

|
| Fluor's bottoming process looks vulnerable to further declines should this descending triangle breakdown. |
| Graphic provided by: MetaStock. |
| |
| This price action has Fluor Corporation developing a descending triangle formation. The descending triangle is a continuation formation that can occur during a downtrend as a bear market rally gives way to a rest of the bear market low. The defining characteristic of descending triangles is a downward sloping resistance trendline that guides highs lower, along with a horizontal support line that has been repeatedly and successfully tested. |
| What fuels the "coil" that eventually results in a breakout (up) or breakdown (down) is the repeated successful tests of support at the bottom combined with the ever-lowering resistance level at the top. As prices get squeezed by the converging trendlines, price ranges get narrower and narrower until it becomes easier for bull or bears -whichever group feels more confident on the eventual outcome - to make a bet on the stock's likely direction. Those bets are what cause the breakout. |
| The top of the descending triangle in FLR is at 47, with horizontal support at 35. The measurement rule for descending triangles calls for subtracting the formation height from the value at the support area. This yields a likely downside target of 23: formation size (12) subtracted from the support value (35). Although not shown on the chart provided, there is significant support in the mid-low 20s - if for no other reason than the fact that FLR would be revisiting historic lows at that point. Intermediate support, albeit limited, would first be encountered around 30, should a breakout occur. |
Technical Writer for Technical Analysis of STOCKS & COMMODITIES magazine, Working-Money.com, and Traders.com Advantage.
| Title: | Technical Writer |
| Company: | Technical Analysis, Inc. |
| Address: | 4757 California Avenue SW |
| Seattle, WA 98116 | |
| Phone # for sales: | 206 938 0570 |
| Fax: | 206 938 1307 |
| Website: | www.Traders.com |
| E-mail address: | DPenn@traders.com |
Traders' Resource Links | |
| Charting the Stock Market: The Wyckoff Method -- Books | |
| Working-Money.com -- Online Trading Services | |
| Traders.com Advantage -- Online Trading Services | |
| Technical Analysis of Stocks & Commodities -- Publications and Newsletters | |
| Working Money, at Working-Money.com -- Publications and Newsletters | |
| Traders.com Advantage -- Publications and Newsletters | |
| Professional Traders Starter Kit -- Software | |
Click here for more information about our publications!
PRINT THIS ARTICLE

Request Information From Our Sponsors
- VectorVest, Inc.
- Executive Premier Workshop
- One-Day Options Course
- OptionsPro
- Retirement Income Workshop
- Sure-Fire Trading Systems (VectorVest, Inc.)
- Trading as a Business Workshop
- VectorVest 7 EOD
- VectorVest 7 RealTime/IntraDay
- VectorVest AutoTester
- VectorVest Educational Services
- VectorVest OnLine
- VectorVest Options Analyzer
- VectorVest ProGraphics v6.0
- VectorVest ProTrader 7
- VectorVest RealTime Derby Tool
- VectorVest Simulator
- VectorVest Variator
- VectorVest Watchdog
- StockCharts.com, Inc.
- Candle Patterns
- Candlestick Charting Explained
- Intermarket Technical Analysis
- John Murphy on Chart Analysis
- John Murphy's Chart Pattern Recognition
- John Murphy's Market Message
- MurphyExplainsMarketAnalysis-Intermarket Analysis
- MurphyExplainsMarketAnalysis-Visual Analysis
- StockCharts.com
- Technical Analysis of the Financial Markets
- The Visual Investor
