HOT TOPICS LIST
- MACD
- Fibonacci
- RSI
- Gann
- ADXR
- Stochastics
- Volume
- Triangles
- Futures
- Cycles
- Volatility
- ZIGZAG
- MESA
- Retracement
- Aroon
INDICATORS LIST
LIST OF TOPICS
PRINT THIS ARTICLE
by Chaitali Mohile
The breakout is likely to initiate the new trend reversal rally for MSPD.
Position: Buy
Chaitali Mohile
Active trader in the Indian stock markets since 2003 and a full-time writer. Trading is largely based upon technical analysis.
PRINT THIS ARTICLE
BREAKOUTS
The Breakout Of MSPD
09/29/10 02:47:39 PMby Chaitali Mohile
The breakout is likely to initiate the new trend reversal rally for MSPD.
Position: Buy
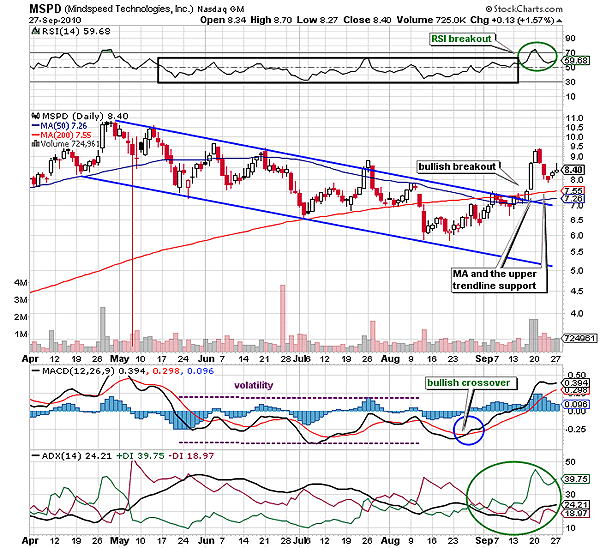
| Mindspeed Technology (MSPD) was in an intermediate downtrend. A descending channel in Figure 1 shows the stock's descending journey in the bearish trend. The channel was formed due to the lower lows and lower highs in the price rally. MSPD has moved perfectly within the channel, opening smaller buying and selling opportunities between the two trendlines. The breakout of the descending channel in an upward direction is a major bullish trend reversal but the bearish force would enhance in case the channel breaches down. MSPD moved in the descending channel for about five months. The relative strength index (RSI) (14) was range-bound between the 50 and 30 levels, indicating a bearish strength in the downside rally. The average directional index (ADX) (14) indicated the developing downtrend and enforced the bearish strength in the rally. The moving average convergence/divergence (MACD) (12,26,9) was volatile in negative territory. |

|
| FIGURE 1: MSPD, DAILY. The descending channel is breached upward, initiating the fresh bullish rally and the new uptrend. |
| Graphic provided by: StockCharts.com. |
| |
| The descending upper trendline, the 50-day, and the 200-day MA intercepted at one point, gathering a huge bearish pressure at that level. However, the technical picture in Figure 1 gradually changed as the price approached this resistance level. MSPD marginally consolidated before breaching the resistance level at 7.55. Meanwhile, the RSI (14) surged above 50 levels, the MACD (12,26,9) ascended after a bullish crossover in negative territory, and the ADX (14) developed a fresh uptrend by surging above 20 levels (see the marking in Figure 1). Thus, the bullish sentiments resulted in a bullish breakout of the descending channel as well as the MAs. After the breakout, the stock immediately retraced to test the newly formed supports. |
| The two white candles in Figure 1 are followed by three red candles. The candlesticks show two strong bullish sessions and three bearish days that engulfed the previous gains of the breakout rally. Since the uptrend was getting stronger as the ADX (14) climbed higher above 20 levels, the price resumed the breakout journey before resting on the support (see small bullish doji). Thus, the bullish force was reflected on the entire daily chart in Figure 1, indicating the successful rally ahead. |

|
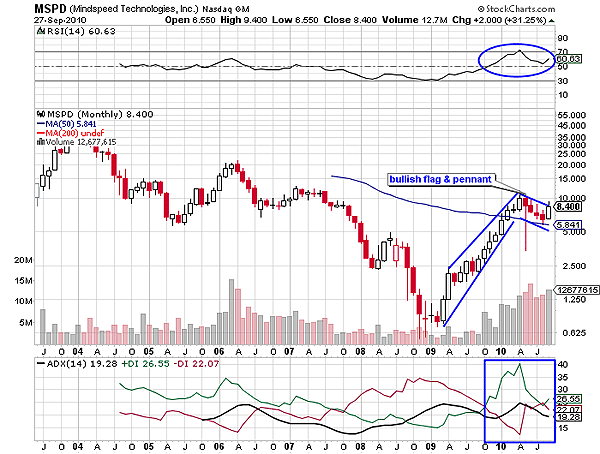
| FIGURE 2: MSPD, MONTHLY. The indicators on the chart show the possibility of the bullish breakout of the flag & pennant formation. |
| Graphic provided by: StockCharts.com. |
| |
| The monthly chart in Figure 2 gave a long-term perspective for MSPD. A bullish flag & pennant, a bullish continuation pattern, is formed in Figure 2. The RSI (14) has established support at 50 levels and is tipped up to begin another upward move. The ADX (14) has marginally dipped below the 20 levels; however, the buying pressure is huge. Therefore, the indicators are showing significant bullish strength that would help bullish breakout of the continuation pattern. Currently, the flag & pennant has not broken, so traders need not rush to trigger the long-term buy setup. The confirmed breakout above $9 and a developing uptrend breakout would be the favorable conditions for fresh long positions. The minimum estimated levels for the long-term traders and investor would be 10 - 1 = 9 (length of the flag pole) + 9 (breakout level) = 18. |
| Thus, the bullish breakout of the descending channel has generated bullish sentiments and is ready to develop a robust uptrend for MSPD. |
Active trader in the Indian stock markets since 2003 and a full-time writer. Trading is largely based upon technical analysis.
| Company: | Independent |
| Address: | C1/3 Parth Indraprasth Towers. Vastrapur |
| Ahmedabad, Guj 380015 | |
| E-mail address: | chaitalimohile@yahoo.co.in |
Traders' Resource Links | |
| Independent has not added any product or service information to TRADERS' RESOURCE. | |
Click here for more information about our publications!
PRINT THIS ARTICLE

Request Information From Our Sponsors
- VectorVest, Inc.
- Executive Premier Workshop
- One-Day Options Course
- OptionsPro
- Retirement Income Workshop
- Sure-Fire Trading Systems (VectorVest, Inc.)
- Trading as a Business Workshop
- VectorVest 7 EOD
- VectorVest 7 RealTime/IntraDay
- VectorVest AutoTester
- VectorVest Educational Services
- VectorVest OnLine
- VectorVest Options Analyzer
- VectorVest ProGraphics v6.0
- VectorVest ProTrader 7
- VectorVest RealTime Derby Tool
- VectorVest Simulator
- VectorVest Variator
- VectorVest Watchdog
- StockCharts.com, Inc.
- Candle Patterns
- Candlestick Charting Explained
- Intermarket Technical Analysis
- John Murphy on Chart Analysis
- John Murphy's Chart Pattern Recognition
- John Murphy's Market Message
- MurphyExplainsMarketAnalysis-Intermarket Analysis
- MurphyExplainsMarketAnalysis-Visual Analysis
- StockCharts.com
- Technical Analysis of the Financial Markets
- The Visual Investor
