HOT TOPICS LIST
- MACD
- Fibonacci
- RSI
- Gann
- ADXR
- Stochastics
- Volume
- Triangles
- Futures
- Cycles
- Volatility
- ZIGZAG
- MESA
- Retracement
- Aroon
INDICATORS LIST
LIST OF TOPICS
PRINT THIS ARTICLE
by Chaitali Mohile
The North American Telecommunication Index is in a completely bullish mood.
Position: Buy
Chaitali Mohile
Active trader in the Indian stock markets since 2003 and a full-time writer. Trading is largely based upon technical analysis.
PRINT THIS ARTICLE
TRIANGLES
$XTC Has A Long Way Ahead
09/27/10 01:42:51 PMby Chaitali Mohile
The North American Telecommunication Index is in a completely bullish mood.
Position: Buy
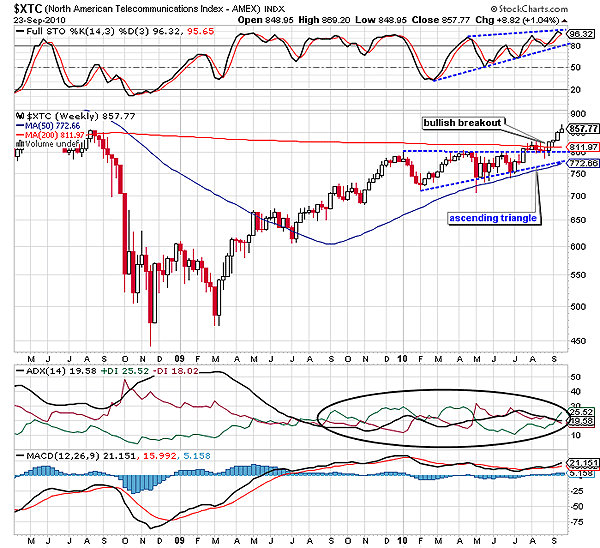
| A bullish rally of the North American Telecommunication Index ($XTC) consolidated under the resistance of the 200-day moving average (MA). An upper range of the consolidation was very well guarded by the long-term MA resistance, and as a result, $XTC formed a horizontal or a flat seller's line; see the upper dotted line in Figure 1. The lower line is climbing due to higher lows, forming an ascending buyer's line. The consolidation formed an ascending triangle, a bullish continuation, or a bullish trend reversal pattern. In an existing uptrend, the pattern is a continuation pattern that resumes the bullish rally after the breakout and a trend reversal if the pattern appears at the bottom of the bearish rally or in a downtrend. In Figure 1, the ascending pattern has appeared after the bullish rally, and so, it is considered to be a continuation formation though the uptrend is shaky. |
| The average directional index (ADX) (14) in Figure 1 is trapped between the 19 and 25 levels with frequently changing buying and selling pressures, indicating an unstable trend. The moving average convergence/divergence (MACD) (12,26,9) has surged in positive territory after a bullish crossover in the negative region. Although the MACD line is tangled with the trigger line and the gap between the two lines is diminishing, the indicator has established support in the positive area. The full stochastic (14,3,3) is undergoing a snaky move in an overbought zone. Thus, the two indicators (stochastic and MACD) are bullish, suggesting bullish momentum. Therefore, the triangular breakout would initiate a robust bullish rally. |

|
| FIGURE 1: $XTC, WEEKLY. The bullish breakout has initiated the robust rally as the 200-day MA resistance has been violated along with the triangle breakout. |
| Graphic provided by: StockCharts.com. |
| |
| $XTC has witnessed a major breakout as the 200-day MA resistance is also breached along with the ascending triangle in Figure 1. Considering the length of the pattern, we can measure the potential target of the bullish breakout; 800 - 725 = 75 is the length of triangle, and therefore, adding 75 to the breakout level, 811, we get the minimum estimated level of 886. The index has already reached 857, so new trades should not be entered at the current level. However, those already long can carry their long positions with the above-mentioned target. The new rally has the supports of the 200-day MA and the seller's line of the triangle, so $XTC could retrace to test the support level, offering fresh buying opportunities for traders waiting on the sidelines. The ADX (14) needs to move above 20 levels to boost the breakout rally. |
| Although the target of 886 has moved closer, the indicators and price chart of $XTC is healthily bullish for the long term. |
Active trader in the Indian stock markets since 2003 and a full-time writer. Trading is largely based upon technical analysis.
| Company: | Independent |
| Address: | C1/3 Parth Indraprasth Towers. Vastrapur |
| Ahmedabad, Guj 380015 | |
| E-mail address: | chaitalimohile@yahoo.co.in |
Traders' Resource Links | |
| Independent has not added any product or service information to TRADERS' RESOURCE. | |
Click here for more information about our publications!
PRINT THIS ARTICLE

Request Information From Our Sponsors
- StockCharts.com, Inc.
- Candle Patterns
- Candlestick Charting Explained
- Intermarket Technical Analysis
- John Murphy on Chart Analysis
- John Murphy's Chart Pattern Recognition
- John Murphy's Market Message
- MurphyExplainsMarketAnalysis-Intermarket Analysis
- MurphyExplainsMarketAnalysis-Visual Analysis
- StockCharts.com
- Technical Analysis of the Financial Markets
- The Visual Investor
- VectorVest, Inc.
- Executive Premier Workshop
- One-Day Options Course
- OptionsPro
- Retirement Income Workshop
- Sure-Fire Trading Systems (VectorVest, Inc.)
- Trading as a Business Workshop
- VectorVest 7 EOD
- VectorVest 7 RealTime/IntraDay
- VectorVest AutoTester
- VectorVest Educational Services
- VectorVest OnLine
- VectorVest Options Analyzer
- VectorVest ProGraphics v6.0
- VectorVest ProTrader 7
- VectorVest RealTime Derby Tool
- VectorVest Simulator
- VectorVest Variator
- VectorVest Watchdog
