HOT TOPICS LIST
- MACD
- Fibonacci
- RSI
- Gann
- ADXR
- Stochastics
- Volume
- Triangles
- Futures
- Cycles
- Volatility
- ZIGZAG
- MESA
- Retracement
- Aroon
INDICATORS LIST
LIST OF TOPICS
PRINT THIS ARTICLE
by Koos van der Merwe
I have been writing that the market is in a new bull market for more than a year now. Is the QQQQ confirming this?
Position: Buy
Koos van der Merwe
Has been a technical analyst since 1969, and has worked as a futures and options trader with First Financial Futures in Johannesburg, South Africa.
PRINT THIS ARTICLE
HEAD & SHOULDERS
Is NASDAQ Showing The Way?
09/27/10 09:25:26 AMby Koos van der Merwe
I have been writing that the market is in a new bull market for more than a year now. Is the QQQQ confirming this?
Position: Buy
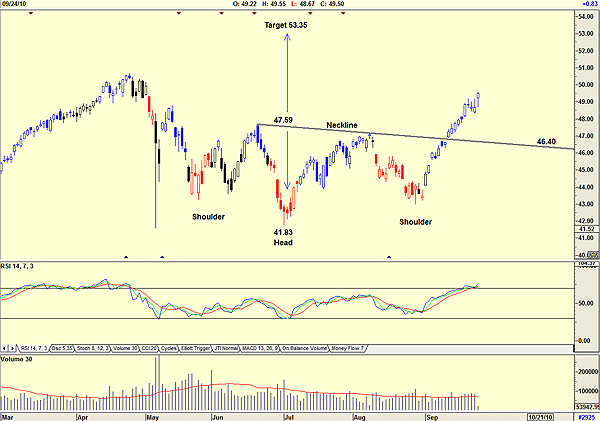
| The QQQQ is the PowerShares exchange traded fund that tracks the NASDAQ 100 index. Figure 1 shows a daily chart. |

|
| FIGURE 1: QQQQ, DAILY |
| Graphic provided by: AdvancedGET. |
| |
| Figure 1 shows an inverse head & shoulder pattern, with a target of $53.35 (47.59 - 41.83 = 5.76 + 47.59 = 53.35). However, the relative strength index (RSI) is suggesting an overbought position. However, we can see that the indicator is inclined to stay in this position for some time before a definite sell occurs. The QQQQ ETF could therefore reach the target of $53.35 or fall to retest the neckline at or about the $46.40 level before continuing higher. September, normally the quietest month of the year, has proved the opposite. September has been an excellent month for the market. Then, of course, there is always the question of October, notorious for major crashes. |

|
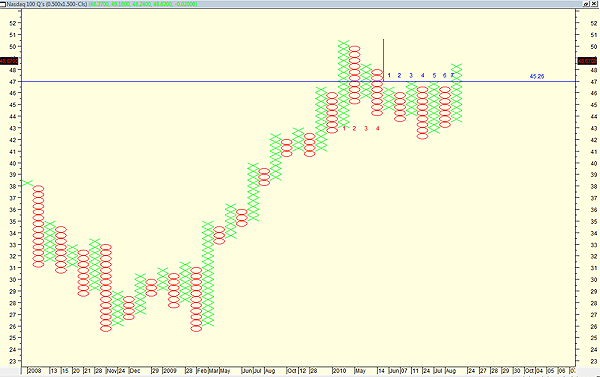
| FIGURE 2: QQQQ, POINT & FIGURE |
| Graphic provided by: MetaStock. |
| |
| Figure 2 is a point & figure chart of the QQQQs with the parameters 0.5 and a three-point reversal. I like using this chart for a horizontal target count. On the chart I have shown the depth of my conservative count, using seven columns. More adventurous investors could include the four columns I have shown in red. The calculations are as follows: Conservative target: Depth 7 x 0.5 x 3 = 10.5 + 45.26 (breakout level) = 55.31 (target) More adventurous: Depth 11 x 0.5 x 3 = 16.5 + 45.26 = 61.31 (target) Of course, with the inverted head & shoulders pattern suggesting a target of $53.35 and the conservative P&F horizontal count suggesting a target of $55.31, I will look to a target in this price range before a major correction. |

|
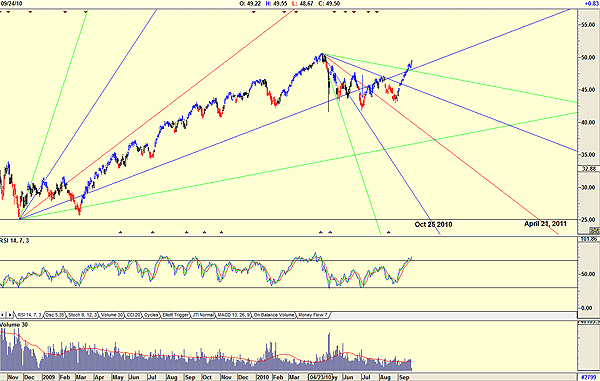
| FIGURE 3: QQQQ, GANN FANNS, DAILY |
| Graphic provided by: AdvancedGET. |
| |
| As to when the target will be reached, and a correction occur, my Gann fan timing model suggests two dates (Figure 3): October 25, 2010, and April 21, 2011. At the moment, with October's notoriety, I will be cautious from around October 20. The QQQQs are suggesting a bullish target between $53 and $55, with a possible date of October 25 before a correction down. |
Has been a technical analyst since 1969, and has worked as a futures and options trader with First Financial Futures in Johannesburg, South Africa.
| Address: | 3256 West 24th Ave |
| Vancouver, BC | |
| Phone # for sales: | 6042634214 |
| E-mail address: | petroosp@gmail.com |
Click here for more information about our publications!
PRINT THIS ARTICLE

Request Information From Our Sponsors
- StockCharts.com, Inc.
- Candle Patterns
- Candlestick Charting Explained
- Intermarket Technical Analysis
- John Murphy on Chart Analysis
- John Murphy's Chart Pattern Recognition
- John Murphy's Market Message
- MurphyExplainsMarketAnalysis-Intermarket Analysis
- MurphyExplainsMarketAnalysis-Visual Analysis
- StockCharts.com
- Technical Analysis of the Financial Markets
- The Visual Investor
- VectorVest, Inc.
- Executive Premier Workshop
- One-Day Options Course
- OptionsPro
- Retirement Income Workshop
- Sure-Fire Trading Systems (VectorVest, Inc.)
- Trading as a Business Workshop
- VectorVest 7 EOD
- VectorVest 7 RealTime/IntraDay
- VectorVest AutoTester
- VectorVest Educational Services
- VectorVest OnLine
- VectorVest Options Analyzer
- VectorVest ProGraphics v6.0
- VectorVest ProTrader 7
- VectorVest RealTime Derby Tool
- VectorVest Simulator
- VectorVest Variator
- VectorVest Watchdog
