HOT TOPICS LIST
- MACD
- Fibonacci
- RSI
- Gann
- ADXR
- Stochastics
- Volume
- Triangles
- Futures
- Cycles
- Volatility
- ZIGZAG
- MESA
- Retracement
- Aroon
INDICATORS LIST
LIST OF TOPICS
PRINT THIS ARTICLE
by Billy Williams
This week, you should know the direction of the overall market and spot price patterns like these to succeed.
Position: Hold
Billy Williams
Billy Williams has been trading the markets for 27 years, specializing in momentum trading with stocks and options.
PRINT THIS ARTICLE
TECHNICAL ANALYSIS
Strong Price Patterns In The Current Market
09/24/10 09:10:35 AMby Billy Williams
This week, you should know the direction of the overall market and spot price patterns like these to succeed.
Position: Hold
| While buy & hold investors may be grimacing every time they open their 401K statements, the current market is revealing lots of opportunities for smart traders in the form of price patterns. Understanding the current market dynamics by understanding the directional bias of the market allows skilled stock speculators to spot low-risk trade setups using price patterns. Currently, all signs show that the market has a bias to the upside. The Standard & Poor's 500 experienced an O'Neil "Follow Thru Day" (FTD) in early September 2010, which was followed by trading up through a downtrend line. This combination indicates a firm bottom in place where the market was able to find its legs, allowing the bulls to take control of the SPX, taking it upward while the rest of the stock market followed. |

|
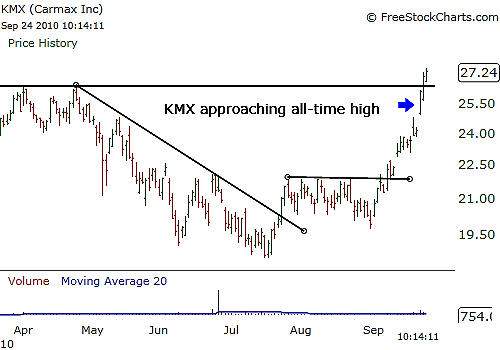
| FIGURE 1: KMX. KMX breaks out higher on the handle portion of a cup & handle formation near its all-time price high. |
| Graphic provided by: www.freestockcharts.com. |
| |
| By chunking down to the individual stocks, you can see that there are numerous stocks trading near their highs, forming distinct patterns in their price action, which again a skilled speculator can spot and trade in the direction of the overall market. One of these, Carmax (KMX), has traded up near its all-time high and broken out in convincing fashion (Figure 1). On its five-year chart, it was noted that a cup & handle pattern has formed where recently the break above $26.50 pivot point validates a strong entry on the handle formation of the pattern. |

|
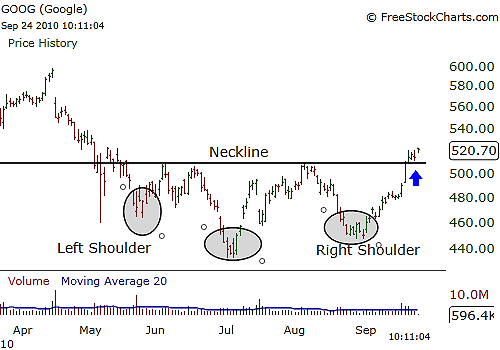
| FIGURE 2: GOOG. GOOG trades up through the neckline of an inverted head & shoulders pattern, revealing a new trend taking place. |
| Graphic provided by: www.freestockcharts.com. |
| |
| Google (GOOG) formed an inverted head & shoulders pattern, which indicates that a bottom has been put in place (Figure 2). GOOG has been in a downtrend after breaking down from a bearish triangle pattern, and though the company has a strong position in the market as well as a strong brand, it has suffered from a decline in its price action. However, as of September 21, 2010, the neckline to the price pattern in this stock gives signs that the downtrend is over and should give GOOG's price action a push to reverse to a bullish direction. The buy signal was confirmed with a higher than average trade volume, and if the new trend holds, pullback opportunities may occur as it trades higher from here. |

|
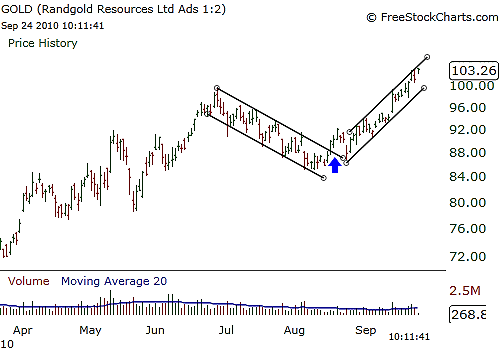
| FIGURE 3: GOLD. GOLD reverses its downtrend, forming a new price channel to the upside. |
| Graphic provided by: www.freestockcharts.com. |
| |
| Randgold Resources Ltd. (GOLD) has also experienced a trend reversal after a shallow decline (Figure 3). The stock's price action has recovered some of the lost ground it gave way to after it traded down from $99.67, trading all the way down to the 0.618 Fibonacci retracement from the last price leg upward, forming a downward price channel along the way. On August 17, 2010, price traded up through the upper portion of the channel pattern and consequently changed the trend's overall direction. After trading back and forth, price began to creep up and over time it formed an upward price channel while finally trading up to a new all-time high. |

|
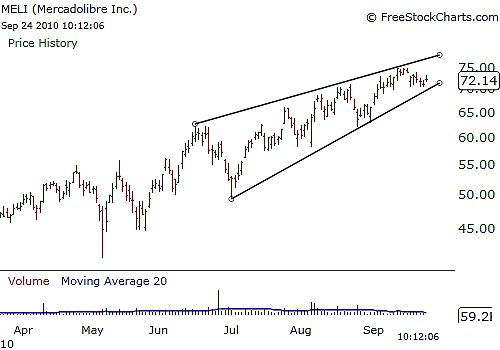
| FIGURE 4: MELI. MELI has a good run to the upside, trading at new highs, but price is forming a reversal pattern, a rising wedge channel. Will it go higher or reverse sharply? |
| Graphic provided by: www.freestockcharts.com. |
| |
| Mercadolibre Inc. (MELI) has traded to a new all-time high as well, but its price action is becoming more constricted near the tops of its range, forming a rising wedge channel (Figure 4). Typically, this is a reversal pattern where price trades down through the lower channel, showing a reversal in the uptrend. For this pattern to be invalidated, price will have to trade up through its upper channel on high volume, but if it does trade lower, then given the bullish bias in the overall market, it could mean that this stock has traded too far, too fast, and simply needs a breather by the traders who are involved in it. Price could decline, consolidate for a while, and then take off again, so use caution with this stock. The market is looking healthier and by keeping in mind the dominant trend and looking for patterns that validate that bias, then trading in its direction, you can trade with the wind at your back and be more successful doing so. |
Billy Williams has been trading the markets for 27 years, specializing in momentum trading with stocks and options.
| Company: | StockOptionSystem.com |
| E-mail address: | stockoptionsystem.com@gmail.com |
Traders' Resource Links | |
| StockOptionSystem.com has not added any product or service information to TRADERS' RESOURCE. | |
Click here for more information about our publications!
Comments
Date: 09/28/10Rank: 4Comment:

Request Information From Our Sponsors
- StockCharts.com, Inc.
- Candle Patterns
- Candlestick Charting Explained
- Intermarket Technical Analysis
- John Murphy on Chart Analysis
- John Murphy's Chart Pattern Recognition
- John Murphy's Market Message
- MurphyExplainsMarketAnalysis-Intermarket Analysis
- MurphyExplainsMarketAnalysis-Visual Analysis
- StockCharts.com
- Technical Analysis of the Financial Markets
- The Visual Investor
- VectorVest, Inc.
- Executive Premier Workshop
- One-Day Options Course
- OptionsPro
- Retirement Income Workshop
- Sure-Fire Trading Systems (VectorVest, Inc.)
- Trading as a Business Workshop
- VectorVest 7 EOD
- VectorVest 7 RealTime/IntraDay
- VectorVest AutoTester
- VectorVest Educational Services
- VectorVest OnLine
- VectorVest Options Analyzer
- VectorVest ProGraphics v6.0
- VectorVest ProTrader 7
- VectorVest RealTime Derby Tool
- VectorVest Simulator
- VectorVest Variator
- VectorVest Watchdog
