

HOT TOPICS LIST
- MACD
- Fibonacci
- RSI
- Gann
- ADXR
- Stochastics
- Volume
- Triangles
- Futures
- Cycles
- Volatility
- ZIGZAG
- MESA
- Retracement
- Aroon
INDICATORS LIST
LIST OF TOPICS
PRINT THIS ARTICLE
by Billy Williams
Learn how to tell whether a stock will resume its trend after a decline and how to enter early on with low risk.
Position: Buy
Billy Williams
Billy Williams has been trading the markets for 27 years, specializing in momentum trading with stocks and options.
PRINT THIS ARTICLE
FIBONACCI
How To Profit From A Deep Stock Decline
09/23/10 08:45:18 AMby Billy Williams
Learn how to tell whether a stock will resume its trend after a decline and how to enter early on with low risk.
Position: Buy
| When a stock is trending up for a period of time, it can be easy to take for granted that it will continue forever, but when the overall market sells off, a stock can take a beating and decline quickly. The strongest stocks, the leaders, which make new highs and help take the market higher, typically are resistant to declines, but even mass selling in the market can take the stock considerably lower from its price highs. Experience has shown that all stocks will move in tandem with the general market 70% to 80% of the time, so if the market overall is under distribution, then even the strongest stocks will decline. Fortunately, as the market recovers, so do individual stocks, and if you use some fundamental technical skills, you can latch onto a stock that is recovering and resuming its uptrend. |
| First, measure the type of decline using Fibonacci numbers, commonly called "Fib numbers." Fibonacci numbers are based on the naturally occurring pattern found in nature discovered by an Italian mathematician in the 13th century, Leonardo Pisano Bigollo. There are two ways to measure a price retracement using Fib numbers: one, to measure from the low price point to the high price point measure the decline from the high, and two, after a steep decline you want to measure the retracement from the high price point to the low price point. In the first method, any decline from the price high that declines to the 0.382 or 0.50 Fibonacci level will typically stand a reasonably good chance to recover and then meet or trade up through the previous price high. See Figure 1. |
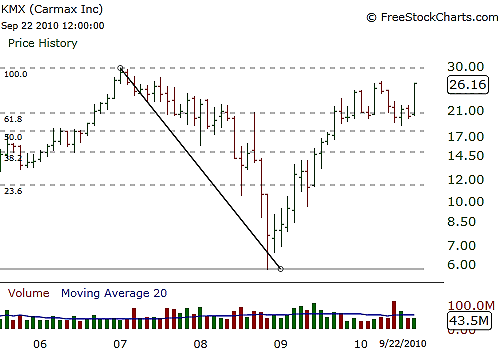
|
| FIGURE 1: KMX. KMX recovers up to 80% of its price decline measured by Fibonacci retracements and approaches its all-time high while also forming a cup & handle pattern. |
| Graphic provided by: www.freestockcharts.com. |
| |
| In the second method, after a stock suffers a steep price decline with its price actually trading below the previous price low, you will want to measure the stock's recovery. If the stock trades upward from its low point and recovers up to 80% of the price decline it experienced, then there is a 80% chance that the stock will meet or trade up through its former price high. Once you've grasped how and when to measure a decline in the stock's price action, start looking at different price charts to get a grasp of how the stock is behaving. There are two types of price action that you want to observe and take note of: expansion and contraction. See Figure 2. |
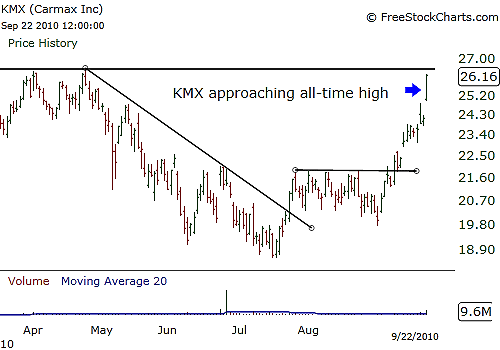
|
| FIGURE 2: KMX, DAILY. On the daily chart, KMX shows a trendline break to the upside, then a contracting price range, and, finally, expansive price action toward its all-time high. |
| Graphic provided by: www.freestockcharts.com. |
| |
| Periods of price contraction occur when neither the buyers or sellers have taken control of the stock's direction, causing it to oscillate back and forth. Price expansion occurs when price action moves with deliberation in a given direction and, in this case, you want to see if it is trying to resume its former trend. |
| Again, there are two ways to spot bullish price movement, and that is by using trendlines to identify the price action in place to see how it is unfolding, and second, by the formation of any chart patterns. By using a combination of Fibonacci retracements, observing price action, and using a combination of trendlines and chart patterns, you can gauge how to best achieve a low-risk entry early on as a stock resumes its bullish trend. |
Billy Williams has been trading the markets for 27 years, specializing in momentum trading with stocks and options.
| Company: | StockOptionSystem.com |
| E-mail address: | stockoptionsystem.com@gmail.com |
Traders' Resource Links | |
| StockOptionSystem.com has not added any product or service information to TRADERS' RESOURCE. | |
Click here for more information about our publications!
Comments
Date:�09/28/10Rank:�4Comment:�

Request Information From Our Sponsors
- StockCharts.com, Inc.
- Candle Patterns
- Candlestick Charting Explained
- Intermarket Technical Analysis
- John Murphy on Chart Analysis
- John Murphy's Chart Pattern Recognition
- John Murphy's Market Message
- MurphyExplainsMarketAnalysis-Intermarket Analysis
- MurphyExplainsMarketAnalysis-Visual Analysis
- StockCharts.com
- Technical Analysis of the Financial Markets
- The Visual Investor
- VectorVest, Inc.
- Executive Premier Workshop
- One-Day Options Course
- OptionsPro
- Retirement Income Workshop
- Sure-Fire Trading Systems (VectorVest, Inc.)
- Trading as a Business Workshop
- VectorVest 7 EOD
- VectorVest 7 RealTime/IntraDay
- VectorVest AutoTester
- VectorVest Educational Services
- VectorVest OnLine
- VectorVest Options Analyzer
- VectorVest ProGraphics v6.0
- VectorVest ProTrader 7
- VectorVest RealTime Derby Tool
- VectorVest Simulator
- VectorVest Variator
- VectorVest Watchdog