HOT TOPICS LIST
- MACD
- Fibonacci
- RSI
- Gann
- ADXR
- Stochastics
- Volume
- Triangles
- Futures
- Cycles
- Volatility
- ZIGZAG
- MESA
- Retracement
- Aroon
INDICATORS LIST
LIST OF TOPICS
PRINT THIS ARTICLE
by Chaitali Mohile
The gold continuous contract is likely to overlook the bearish formation.
Position: Hold
Chaitali Mohile
Active trader in the Indian stock markets since 2003 and a full-time writer. Trading is largely based upon technical analysis.
PRINT THIS ARTICLE
BULL/BEAR MARKET
Gold In Strong Bull Run
09/23/10 12:13:03 PMby Chaitali Mohile
The gold continuous contract is likely to overlook the bearish formation.
Position: Hold
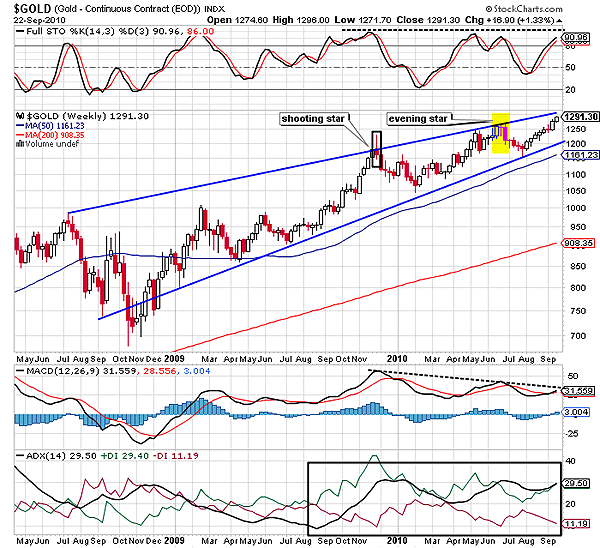
| On the weekly time frame in Figure 1, the gold continuous contract ($GOLD) has formed a very long-term bearish reversal formation -- a rising wedge. The wedge has covered the distance of almost (1290 -750) 540 points in a year and a half. Initially, the lower trendline was retested frequently but as the metal gained bullish momentum, the index bounced from the support line. The breakout of the moving average convergence/divergence (MACD) (12,26,9) in positive territory supports the developing bullish momentum. The stochastic oscillator also indicated fresh buying opportunity by moving into a bullish area. Gradually, $GOLD surged higher with robust strength and developed a new uptrend. We can see the average directional index (ADX) (14) in Figure 1 has moved above 20 levels with the strong buying pressure, indicating a developing uptrend. |

|
| FIGURE 1: $GOLD, WEEKLY. The index is ready to hit the upper trendline resistance of the rising wedge. |
| Graphic provided by: StockCharts.com. |
| |
| Eventually, $GOLD reached the upper trendline resistance. The resistance line was challenged twice during the entire wedge formation. In December 2009, when the index hit the upper trendline, it formed a shooting star candlestick pattern and later formed an evening star candlestick pattern in June 2010. Both candlestick patterns are bearish reversals, thus dragging the price to the lower trendline support. The two trendlines of the wedge has converged and so has the trading range. The rally that was initiated in August 2010 has steadily moved in the narrow range. The ADX (14) is highlighting a stable bullish trend for the past as well as for the future price action. The small bullish candles at the tip of the wedge are an indication of the steady movement. |
| Since then, the range has narrowed down, the price action will be slow, and $GOLD would retrace to the lower trendline support. The negative divergence of the MACD (12,26,9) warns of a small plunge in the current rally without any major damage. In addition, the precious metal index, $GOLD, has major support of the 50-day moving average (MA). |
| Although $GOLD formed the rising wedge bearish reversal pattern, a bearish breakout is not indicated on the chart in Figure 1. The uptrend would continue and pull the price rally higher. Considering the bullish technical conditions in Figure 1, the rising wedge could break upward, initiating a robust breakout. |
Active trader in the Indian stock markets since 2003 and a full-time writer. Trading is largely based upon technical analysis.
| Company: | Independent |
| Address: | C1/3 Parth Indraprasth Towers. Vastrapur |
| Ahmedabad, Guj 380015 | |
| E-mail address: | chaitalimohile@yahoo.co.in |
Traders' Resource Links | |
| Independent has not added any product or service information to TRADERS' RESOURCE. | |
Click here for more information about our publications!
PRINT THIS ARTICLE

Request Information From Our Sponsors
- StockCharts.com, Inc.
- Candle Patterns
- Candlestick Charting Explained
- Intermarket Technical Analysis
- John Murphy on Chart Analysis
- John Murphy's Chart Pattern Recognition
- John Murphy's Market Message
- MurphyExplainsMarketAnalysis-Intermarket Analysis
- MurphyExplainsMarketAnalysis-Visual Analysis
- StockCharts.com
- Technical Analysis of the Financial Markets
- The Visual Investor
- VectorVest, Inc.
- Executive Premier Workshop
- One-Day Options Course
- OptionsPro
- Retirement Income Workshop
- Sure-Fire Trading Systems (VectorVest, Inc.)
- Trading as a Business Workshop
- VectorVest 7 EOD
- VectorVest 7 RealTime/IntraDay
- VectorVest AutoTester
- VectorVest Educational Services
- VectorVest OnLine
- VectorVest Options Analyzer
- VectorVest ProGraphics v6.0
- VectorVest ProTrader 7
- VectorVest RealTime Derby Tool
- VectorVest Simulator
- VectorVest Variator
- VectorVest Watchdog
