HOT TOPICS LIST
- MACD
- Fibonacci
- RSI
- Gann
- ADXR
- Stochastics
- Volume
- Triangles
- Futures
- Cycles
- Volatility
- ZIGZAG
- MESA
- Retracement
- Aroon
INDICATORS LIST
LIST OF TOPICS
PRINT THIS ARTICLE
by Donald W. Pendergast, Jr.
Chart pattern analysis is perhaps more art and intuition than science, but the current triple-top buy setup in the Russell 2000 demands more than a passing glance.
Position: N/A
Donald W. Pendergast, Jr.
Donald W. Pendergast is a financial markets consultant who offers specialized services to stock brokers and high net worth individuals who seek a better bottom line for their portfolios.
PRINT THIS ARTICLE
CHART ANALYSIS
Russell 2000 Triple-Top Buy?
09/23/10 08:28:57 AMby Donald W. Pendergast, Jr.
Chart pattern analysis is perhaps more art and intuition than science, but the current triple-top buy setup in the Russell 2000 demands more than a passing glance.
Position: N/A
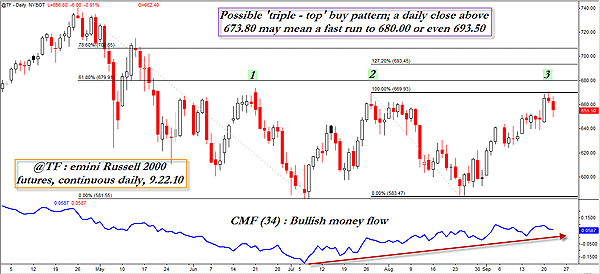
| Some market analysts believe that deflation is already upon us and that the stock market needs to fall much further. Maybe they're right and maybe not, but it's hard to argue with the current bullish bias seen on Figure 1, the daily chart of the front-month Russell 2000 futures contract (TFZ10). |

|
| FIGURE 1: TF, DAILY. With a steadily rising money flow trend already in place, a daily break and close above 673.70 would seem to provide validation for this triple-top buy pattern on the daily chart of the December Russell 2000 emini contract. |
| Graphic provided by: FutureSource.com. |
| |
| Anytime that a stock or futures contract bumps up against a powerful area of support or resistance (S/R) for the third time, especially when the swings are fairly equally spaced, it should be closely monitored for signs of an impending breakout. Right now, a glance at a narrow yet strong area of resistance running from about 670.00 to 673.70 and solid daily break and then closing above this range would paint a very bullish near-term picture for this key small-cap stock index contract. With the short-term Chaikin money flow (CMF)(34) in a rising trend (10 weeks and counting), the odds currently favor a break to the upside, but as we all know, the market will always manage to catch the majority of traders and investors on the wrong side of its ultimate move, no matter how smart they think they are. That said, if 674.00 is taken out on wide range and strong volume, a run up to the 62% Fibonacci retracement (of the May to July downthrust) near 680.00 could be accomplished with very little effort. The 127% Fibonacci extension ratio of the more recent set of price swings is just above that, near 693.50, and that should act as noticeable resistance should it be reached sooner rather than later. |
| Look to play strong relative strength small-cap stocks on a successful triple top break higher; on a failure swing lower, consider buying reasonably priced puts in IWM or TFZ10 (the December Russell emini futures contract), as the selling on a failed long breakout could be notable. |
| Learn to read the market landscape for yourself, and you will be miles ahead of the typical slacker trader/investor, ready to capitalize on whatever opportunity the market decides to throw your way. |
Donald W. Pendergast is a financial markets consultant who offers specialized services to stock brokers and high net worth individuals who seek a better bottom line for their portfolios.
| Title: | Writer, market consultant |
| Company: | Linear Trading Systems LLC |
| Jacksonville, FL 32217 | |
| Phone # for sales: | 904-239-9564 |
| E-mail address: | lineartradingsys@gmail.com |
Traders' Resource Links | |
| Linear Trading Systems LLC has not added any product or service information to TRADERS' RESOURCE. | |
Click here for more information about our publications!
Comments
Date: 09/28/10Rank: 4Comment:

Request Information From Our Sponsors
- StockCharts.com, Inc.
- Candle Patterns
- Candlestick Charting Explained
- Intermarket Technical Analysis
- John Murphy on Chart Analysis
- John Murphy's Chart Pattern Recognition
- John Murphy's Market Message
- MurphyExplainsMarketAnalysis-Intermarket Analysis
- MurphyExplainsMarketAnalysis-Visual Analysis
- StockCharts.com
- Technical Analysis of the Financial Markets
- The Visual Investor
- VectorVest, Inc.
- Executive Premier Workshop
- One-Day Options Course
- OptionsPro
- Retirement Income Workshop
- Sure-Fire Trading Systems (VectorVest, Inc.)
- Trading as a Business Workshop
- VectorVest 7 EOD
- VectorVest 7 RealTime/IntraDay
- VectorVest AutoTester
- VectorVest Educational Services
- VectorVest OnLine
- VectorVest Options Analyzer
- VectorVest ProGraphics v6.0
- VectorVest ProTrader 7
- VectorVest RealTime Derby Tool
- VectorVest Simulator
- VectorVest Variator
- VectorVest Watchdog
