HOT TOPICS LIST
- MACD
- Fibonacci
- RSI
- Gann
- ADXR
- Stochastics
- Volume
- Triangles
- Futures
- Cycles
- Volatility
- ZIGZAG
- MESA
- Retracement
- Aroon
INDICATORS LIST
LIST OF TOPICS
PRINT THIS ARTICLE
by David Penn
One intermarket analysis of the relationship between gold, commodities and interest rates suggests that bonds may be loaded for bear.
Position: N/A
David Penn
Technical Writer for Technical Analysis of STOCKS & COMMODITIES magazine, Working-Money.com, and Traders.com Advantage.
PRINT THIS ARTICLE
TECHNICAL ANALYSIS
Is the Bond Bull Market Over?
01/18/02 01:32:53 PMby David Penn
One intermarket analysis of the relationship between gold, commodities and interest rates suggests that bonds may be loaded for bear.
Position: N/A
| Gold, as the most monetary of all commodities, is widely regarded to be a worthwhile signal for price action in other markets. For example, gold tends to lead other commoditiy prices up or down depending on the relative strength of the U.S. dollar. Both gold and commodity prices tend to move inversely to the greenback, and because gold is the most sensitive to changes in the value of money, gold often advances or declines before the reverberations in any change in the dollar's value works its way through other commodities. |
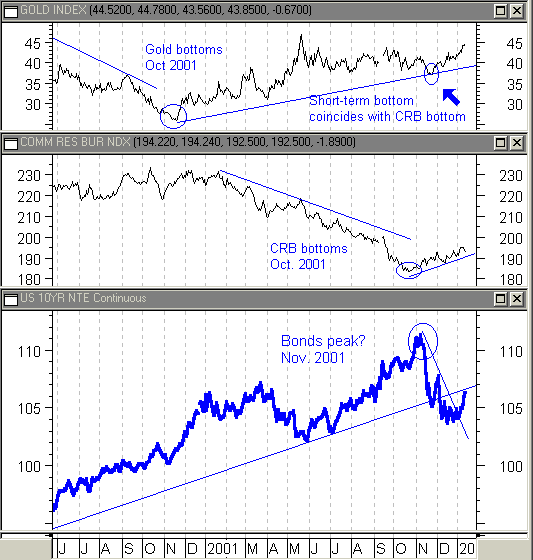
| The chart below shows the bottoming process in both gold and commodities (using the CRB index). Gold was in a bear market from 1998 until October 2001 (there was a brief spike in the fall of 1999). The CRB also reflects a bear market from 1998, although that bear market bottomed in the first half of 1999. A bull market in commodities followed until late in 2000 and the CRB entered 2001 back in a downtrend. This downtrend looks to have ended with a bottom established in October 2001. |

|
| An unsuccessful test of upside resistance means higher long-term interest rates are likely going into 2002. |
| Graphic provided by: MetaStock. |
| |
| While gold did put in an intermediate bottom in October 2001 (see "The Greenback and the CRB," January 11, 2002, Traders.com), the long-term bottom remains one year previous to a long-term bottom in the CRB. This is consistent with the "gold leading commodities" thesis mentioned at the outset. |
| Intermarket technical analysis of the business cycle suggests that commodities will make a bottom after gold does, and that bond prices tend to peak after a commodities bottom. This peaking of bond prices also means that interest rates have bottomed and, with bond prices moving inversely to bond yields, bond yields are likely to climb. Since a peak in the 10-year note in November 2001, the T-note has put in one significant lower high at the beginning of December. A lower low was made on December 14th. This is bearish for bond prices. |
| The 10-year note also broke down through an up-trendline that stretches back to May 2000. The breakdown occurred in early December, just as the T-note was putting in its first significant low after the May 2000 peak. A rally in mid-January has the 10-year back up above a sharp downtrend line from the peak, but the early December high of about 108 remains as a serious test for any enduring upside move. The same can be said for the broken up-trendline from May 2000. The 10-year Treasury will have to surpass this kind of technical upside resistance in order for lower long-term interest rates to happen in 2002. |
Technical Writer for Technical Analysis of STOCKS & COMMODITIES magazine, Working-Money.com, and Traders.com Advantage.
| Title: | Technical Writer |
| Company: | Technical Analysis, Inc. |
| Address: | 4757 California Avenue SW |
| Seattle, WA 98116 | |
| Phone # for sales: | 206 938 0570 |
| Fax: | 206 938 1307 |
| Website: | www.Traders.com |
| E-mail address: | DPenn@traders.com |
Traders' Resource Links | |
| Charting the Stock Market: The Wyckoff Method -- Books | |
| Working-Money.com -- Online Trading Services | |
| Traders.com Advantage -- Online Trading Services | |
| Technical Analysis of Stocks & Commodities -- Publications and Newsletters | |
| Working Money, at Working-Money.com -- Publications and Newsletters | |
| Traders.com Advantage -- Publications and Newsletters | |
| Professional Traders Starter Kit -- Software | |
Click here for more information about our publications!
PRINT THIS ARTICLE

Request Information From Our Sponsors
- StockCharts.com, Inc.
- Candle Patterns
- Candlestick Charting Explained
- Intermarket Technical Analysis
- John Murphy on Chart Analysis
- John Murphy's Chart Pattern Recognition
- John Murphy's Market Message
- MurphyExplainsMarketAnalysis-Intermarket Analysis
- MurphyExplainsMarketAnalysis-Visual Analysis
- StockCharts.com
- Technical Analysis of the Financial Markets
- The Visual Investor
- VectorVest, Inc.
- Executive Premier Workshop
- One-Day Options Course
- OptionsPro
- Retirement Income Workshop
- Sure-Fire Trading Systems (VectorVest, Inc.)
- Trading as a Business Workshop
- VectorVest 7 EOD
- VectorVest 7 RealTime/IntraDay
- VectorVest AutoTester
- VectorVest Educational Services
- VectorVest OnLine
- VectorVest Options Analyzer
- VectorVest ProGraphics v6.0
- VectorVest ProTrader 7
- VectorVest RealTime Derby Tool
- VectorVest Simulator
- VectorVest Variator
- VectorVest Watchdog
