HOT TOPICS LIST
- MACD
- Fibonacci
- RSI
- Gann
- ADXR
- Stochastics
- Volume
- Triangles
- Futures
- Cycles
- Volatility
- ZIGZAG
- MESA
- Retracement
- Aroon
INDICATORS LIST
LIST OF TOPICS
PRINT THIS ARTICLE
by Koos van der Merwe
We all know that home prices have fallen badly with a recession created by banks who offered excessive mortgages, but is it time to start looking to reinvest?
Position: Buy
Koos van der Merwe
Has been a technical analyst since 1969, and has worked as a futures and options trader with First Financial Futures in Johannesburg, South Africa.
PRINT THIS ARTICLE
HEAD & SHOULDERS
Is It Time To Invest In The Housing Market?
09/22/10 08:18:01 AMby Koos van der Merwe
We all know that home prices have fallen badly with a recession created by banks who offered excessive mortgages, but is it time to start looking to reinvest?
Position: Buy
| PMI is an insurance company that provides protection to lenders and investors in the event of borrower default. They protect mortgage lenders and investors from credit losses, and they help to ensure that mortgages are available to qualified homebuyers. With the economy starting to recover, and home prices at extremely low levels, new buyers are starting to appear. Groundbreaking for new US homes jumped in August to a four-month high, a tentative sign of stability in the housing market. So, is it time to buy PMI? Charts say yes. |

|
| FIGURE 1: PMI, MONTHLY |
| Graphic provided by: AdvancedGET. |
| |
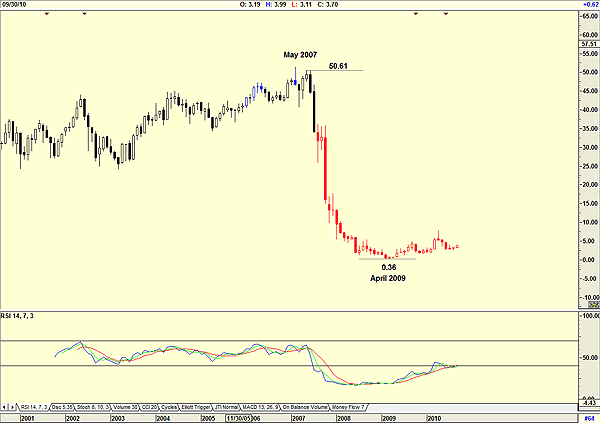
| Figure 1, a monthly chart, shows how the price of PMI fell from a high of $50.61 on May 2007 to a low of an incredible $0.36 by April 2009. Since then, the price has recovered to $3.70. The relative strength index (RSI) is suggesting strength ahead. |

|
| FIGURE 2: PMI, WEEKLY |
| Graphic provided by: AdvancedGET. |
| |
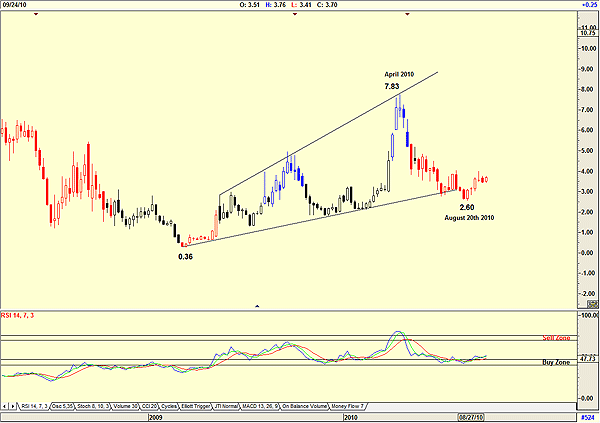
| Figure 2, a weekly chart, shows how the price rose to a high of $7.83 by April 2010 in a trumpet formation, signaling uncertainty. The price fell to $2.60 by August 20 as the RSI gave a sell signal. The RSI has now given a buy signal. |

|
| FIGURE 3: PMI, DAILY |
| Graphic provided by: OmniTrader. |
| |
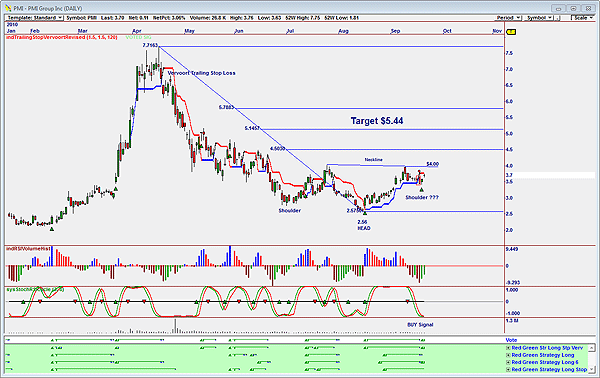
| Figure 3, a daily chart, shows the following: 1. A possible inverted head & shoulders formation developing with a target, should the price break above the neckline at $4.00 of $5.44. 2. The RSI volume histogram has given a buy signal at the present price of $3.70. 3. The stochastic RSI cycle indicator has given a buy signal. 4. Finally, the red green strategy vote line has given a buy signal. This indicator has been reasonably effective in the past, as we can see by looking at the chart. 5. The price is currently testing the Vervoort trailing stop-loss, and a break above it is a confirmation buy signal. I would be a buyer of PMI at present levels. As the market recovers, so should the share price. |
Has been a technical analyst since 1969, and has worked as a futures and options trader with First Financial Futures in Johannesburg, South Africa.
| Address: | 3256 West 24th Ave |
| Vancouver, BC | |
| Phone # for sales: | 6042634214 |
| E-mail address: | petroosp@gmail.com |
Click here for more information about our publications!
Comments
Date: 10/02/10Rank: 5Comment:

Request Information From Our Sponsors
- StockCharts.com, Inc.
- Candle Patterns
- Candlestick Charting Explained
- Intermarket Technical Analysis
- John Murphy on Chart Analysis
- John Murphy's Chart Pattern Recognition
- John Murphy's Market Message
- MurphyExplainsMarketAnalysis-Intermarket Analysis
- MurphyExplainsMarketAnalysis-Visual Analysis
- StockCharts.com
- Technical Analysis of the Financial Markets
- The Visual Investor
- VectorVest, Inc.
- Executive Premier Workshop
- One-Day Options Course
- OptionsPro
- Retirement Income Workshop
- Sure-Fire Trading Systems (VectorVest, Inc.)
- Trading as a Business Workshop
- VectorVest 7 EOD
- VectorVest 7 RealTime/IntraDay
- VectorVest AutoTester
- VectorVest Educational Services
- VectorVest OnLine
- VectorVest Options Analyzer
- VectorVest ProGraphics v6.0
- VectorVest ProTrader 7
- VectorVest RealTime Derby Tool
- VectorVest Simulator
- VectorVest Variator
- VectorVest Watchdog
