HOT TOPICS LIST
- MACD
- Fibonacci
- RSI
- Gann
- ADXR
- Stochastics
- Volume
- Triangles
- Futures
- Cycles
- Volatility
- ZIGZAG
- MESA
- Retracement
- Aroon
INDICATORS LIST
LIST OF TOPICS
PRINT THIS ARTICLE
by Chaitali Mohile
The short-term corrective phase has hit a support level. Will AMMD establish support and resume a fresh bullish rally?
Position: N/A
Chaitali Mohile
Active trader in the Indian stock markets since 2003 and a full-time writer. Trading is largely based upon technical analysis.
PRINT THIS ARTICLE
SUPPORT & RESISTANCE
AMMD At Support
09/21/10 12:02:30 PMby Chaitali Mohile
The short-term corrective phase has hit a support level. Will AMMD establish support and resume a fresh bullish rally?
Position: N/A
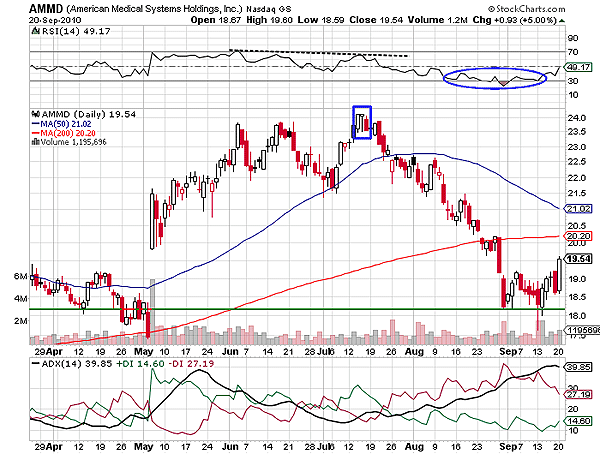
| The small blue box marked in Figure 1 of American Medical Systems Holding (AMMD) shows a bullish candle followed by a small hanging man candlestick pattern. The hanging man turns down the existing uptrend and initiates a fresh downtrend for the stock or indexes. For AMMD, the hanging man candlestick pattern and the negative divergence of the relative strength index (RSI) (14) are the two trend reversal indications. The average directional index (ADX) (14) that was indicating a well-developed uptrend descended by the time a higher high at $24 was made by AMMD. Accordingly, the stock began its bearish move from $24 and gradually breached the 50-day and 200-day moving average (MA) supports. While breaching the 200-day MA support, the two long red candles showed significant bearish force in the rally. |

|
| FIGURE 1: AMMD, DAILY |
| Graphic provided by: StockCharts.com. |
| |
| However, the previous low and a huge gap up in May extended the strong support for the current declining move. In addition, the downtrend was overheated as is indicated by the oversold RSI (14). Both indicators signify that a new bullish rally is under way. Thus, AMMD in Figure 1 established strong support at $18 and is ready to move in the direction of its immediate resistance of the 200-day MA. Due to the converging MA resistances, the RSI (14) below 50 levels, and the existing downtrend, trading is low. |

|
| FIGURE 2: AMMD, WEEKLY |
| Graphic provided by: StockCharts.com. |
| |
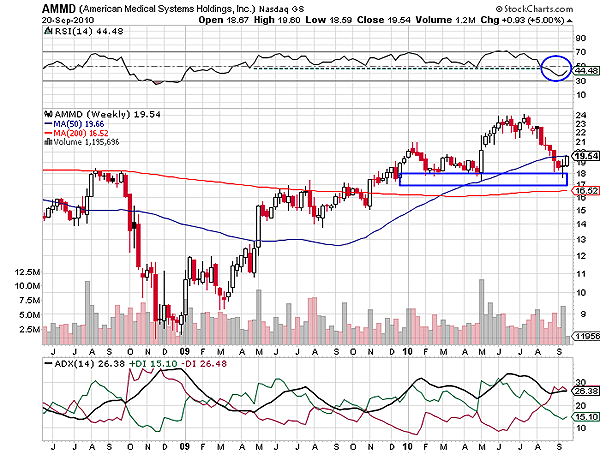
| Figure 2, the weekly chart, shows long-term support at $18 and $17 levels. Since early 2010, AMMD has not violated these levels; instead, the stock has bounced off this support. In May 2010, the stock surged to $24 from $18 and immediately retraced back to the previous low, forming a rounded-top formation. The pattern shows a top formation and terminates the existing bullish rally. The developing uptrend in Figure 2 reversed due to the short-term descending rally. In addition, the center line (50 levels) of the RSI (14) was also breached. But the price rally has solid support at $18, and therefore, the AMMD can hardly drift down the support zone. Although the stock formed a rounded top -- a bearish reversal formation -- the stock has limited downside. Currently, the stock is under the resistance of the 50-day MA. However, once the RSI (14) turns bullish and the downtrend declines or a fresh uptrend is developed, the price would breach the 50-day MA and rush toward the previous high at $24. |
| In summary, $24 is the historical high and a robust resistance for AMMD (refer to the monthly chart). Therefore, the stock would establish robust support at $18 and bounce towards the previous high resistance. |
Active trader in the Indian stock markets since 2003 and a full-time writer. Trading is largely based upon technical analysis.
| Company: | Independent |
| Address: | C1/3 Parth Indraprasth Towers. Vastrapur |
| Ahmedabad, Guj 380015 | |
| E-mail address: | chaitalimohile@yahoo.co.in |
Traders' Resource Links | |
| Independent has not added any product or service information to TRADERS' RESOURCE. | |
Click here for more information about our publications!
PRINT THIS ARTICLE

Request Information From Our Sponsors
- VectorVest, Inc.
- Executive Premier Workshop
- One-Day Options Course
- OptionsPro
- Retirement Income Workshop
- Sure-Fire Trading Systems (VectorVest, Inc.)
- Trading as a Business Workshop
- VectorVest 7 EOD
- VectorVest 7 RealTime/IntraDay
- VectorVest AutoTester
- VectorVest Educational Services
- VectorVest OnLine
- VectorVest Options Analyzer
- VectorVest ProGraphics v6.0
- VectorVest ProTrader 7
- VectorVest RealTime Derby Tool
- VectorVest Simulator
- VectorVest Variator
- VectorVest Watchdog
- StockCharts.com, Inc.
- Candle Patterns
- Candlestick Charting Explained
- Intermarket Technical Analysis
- John Murphy on Chart Analysis
- John Murphy's Chart Pattern Recognition
- John Murphy's Market Message
- MurphyExplainsMarketAnalysis-Intermarket Analysis
- MurphyExplainsMarketAnalysis-Visual Analysis
- StockCharts.com
- Technical Analysis of the Financial Markets
- The Visual Investor
