

HOT TOPICS LIST
- MACD
- Fibonacci
- RSI
- Gann
- ADXR
- Stochastics
- Volume
- Triangles
- Futures
- Cycles
- Volatility
- ZIGZAG
- MESA
- Retracement
- Aroon
INDICATORS LIST
LIST OF TOPICS
PRINT THIS ARTICLE
by Billy Williams
Like the rungs of the ladder, flat base patterns help a stock's price climb higher.
Position: Buy
Billy Williams
Billy Williams has been trading the markets for 27 years, specializing in momentum trading with stocks and options.
PRINT THIS ARTICLE
TECHNICAL ANALYSIS
Flat Base Patterns And Ladder Rungs
09/21/10 11:51:20 AMby Billy Williams
Like the rungs of the ladder, flat base patterns help a stock's price climb higher.
Position: Buy
| As a stock is making its way higher in a bullish trend, traders take note of significant highs in price with each new high, gathering more and more attention. This is typical when an up-and-coming company, or one that has begun to garner favor again, begins to accumulate a string of successive record-breaking quarterly earnings reports, new cutting-edge products into the market, and/or annual sales growth. Add in strong return on equity (ROE), revealing capable management along with little to no company debt, and you have the makings of the next Wall Street darling. This begins a cycle of both multiyear price highs coupled with ever-increasing trade volume as the stock begins to attract speculators from the sidelines, but more important, institutional traders who buy for the major investment firms on the Street. The steady rise of both stock price and trade volume begin a partnership of sorts that slowly increase the stock's value over time, provided that the underlying company continues to strengthen its fundamentals as well as its competitive edge in its respective marketplace, which insures that traders and investors continue to remain interested enough to invest their money. |
|
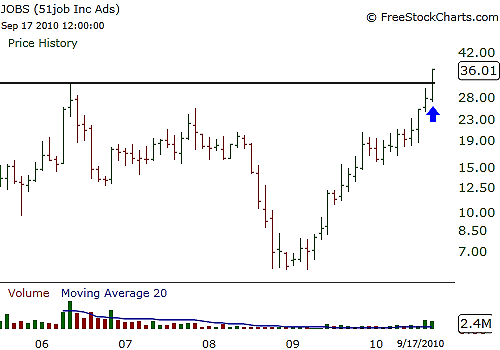
| FIGURE 1: JOBS. Fifty One Job Inc. climbs higher to hit a multiyear high. |
| Graphic provided by: www.freestockcharts.com. |
| |
| This slow steady progression forms a chart pattern called a "flat base" pattern that will provide a stair-step approach for the skilled speculator to latch onto the bullish trend's momentum at the best possible point in the stock's price action. Flat base patterns typically occur once a stock has made a significant high, in this case a bullish trend, where supply for the stock meets increased demand by speculators who believe that the stock's prospects are favorable, driving the existing price of the stock higher. See Figure 1. After a stock's price has been driven higher, investors/traders on the sidelines hesitate to buy in at the new price because they fear they might overpay for the stock. Existing owners of the stock also hesitate, probably for the same reason, and many use this opportunity to sell off their position to take profits. |
|
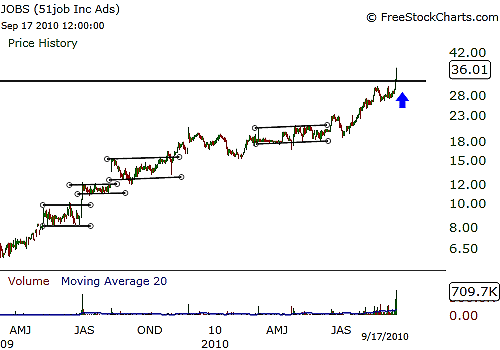
| FIGURE 2: JOBS. The company's stock trends higher, setting signficant highs while forming flat-based patterns along the way. |
| Graphic provided by: www.freestockcharts.com. |
| |
| As the price of the stock falls, buyers who had hesitated to buy the stock at the new high are now jumping in and buying stock at the lower prices, believing they are at a favorable price now. This new level of buying forms the basis of price support within the stock's price action. This ebb and flow in the stock's price action can continue as price consolidates back and forth until demand grows. As demand grows, the stock's price is then driven higher, trading through the previous significant high and stock prices increase to newer highs in price. See Figure 2. These flat base patterns build upon one another over time like rungs on a ladder, each using the other as support to build higher. As a trader, you want to enter the move as the stock trades up through its former high as the stock trades higher on new volume. |
| Why? Because the higher level of volume reveals that more traders are willing to pay higher prices for the stock at that level without being sensitive to the increase in price. This confidence that the stock is a solid investment in the future helps drive the stock's bullish trend and offers you the low risk opportunity to ride the force of the trend's momentum, with higher volume validating the entry point at the same time. |
Billy Williams has been trading the markets for 27 years, specializing in momentum trading with stocks and options.
| Company: | StockOptionSystem.com |
| E-mail address: | stockoptionsystem.com@gmail.com |
Traders' Resource Links | |
| StockOptionSystem.com has not added any product or service information to TRADERS' RESOURCE. | |
Click here for more information about our publications!
Comments
Date:�09/28/10Rank:�4Comment:�

Request Information From Our Sponsors
- StockCharts.com, Inc.
- Candle Patterns
- Candlestick Charting Explained
- Intermarket Technical Analysis
- John Murphy on Chart Analysis
- John Murphy's Chart Pattern Recognition
- John Murphy's Market Message
- MurphyExplainsMarketAnalysis-Intermarket Analysis
- MurphyExplainsMarketAnalysis-Visual Analysis
- StockCharts.com
- Technical Analysis of the Financial Markets
- The Visual Investor
- VectorVest, Inc.
- Executive Premier Workshop
- One-Day Options Course
- OptionsPro
- Retirement Income Workshop
- Sure-Fire Trading Systems (VectorVest, Inc.)
- Trading as a Business Workshop
- VectorVest 7 EOD
- VectorVest 7 RealTime/IntraDay
- VectorVest AutoTester
- VectorVest Educational Services
- VectorVest OnLine
- VectorVest Options Analyzer
- VectorVest ProGraphics v6.0
- VectorVest ProTrader 7
- VectorVest RealTime Derby Tool
- VectorVest Simulator
- VectorVest Variator
- VectorVest Watchdog