HOT TOPICS LIST
- MACD
- Fibonacci
- RSI
- Gann
- ADXR
- Stochastics
- Volume
- Triangles
- Futures
- Cycles
- Volatility
- ZIGZAG
- MESA
- Retracement
- Aroon
INDICATORS LIST
LIST OF TOPICS
PRINT THIS ARTICLE
by Alan R. Northam
Apple looks to be in a topping process. By looking at price patterns, price momentum, and volume, we can come to a clear understanding about the technical condition of this security.
Position: N/A
Alan R. Northam
Alan Northam lives in the Dallas, Texas area and as an electronic engineer gave him an analytical mind from which he has developed a thorough knowledge of stock market technical analysis. His abilities to analyze the future direction of the stock market has allowed him to successfully trade of his own portfolio over the last 30 years. Mr. Northam is now retired and trading the stock market full time. You can reach him at inquiry@tradersclassroom.com or by visiting his website at http://www.tradersclassroom.com. You can also follow him on Twitter @TradersClassrm.
PRINT THIS ARTICLE
Apple Is Ready To Turn Lower
09/20/10 01:26:52 PMby Alan R. Northam
Apple looks to be in a topping process. By looking at price patterns, price momentum, and volume, we can come to a clear understanding about the technical condition of this security.
Position: N/A
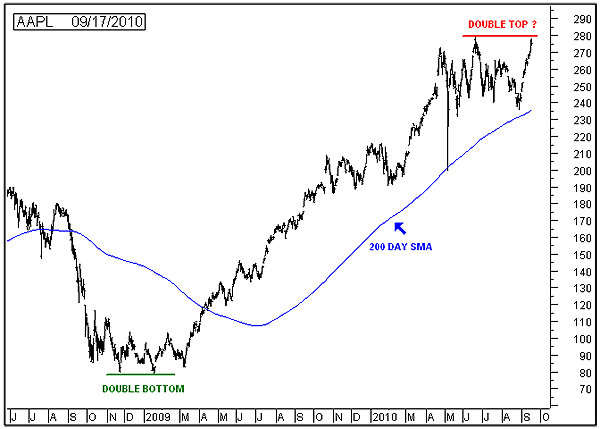
| Figure 1 shows the daily price chart of Apple (AAPL). When I look at Figure 1, I see severe overlapping waves lasting five months from October 2008 until February 2009. This period of severe overlapping waves represents the bottoming process of the preceding bear market, which resulted in a double bottom. From this bottoming process, I also see the emergence of an 18-month bull market rally, during which time price doubled twice for what is known as a "two-bagger." Finally, looking at the period from May 2010 through September 2010, I see a new formation of severe overlapping price waves that most likely represents a topping process in progress with the possibility of the formation of a double-top reversal price pattern. |

|
| FIGURE 1: AAPL, DAILY. Chart of daily price bars with a 200-day simple moving average. Chart shows a double bottom in late 2008 and early 2009 and shows a possible double-top formation in process. |
| Graphic provided by: MetaStock. |
| |
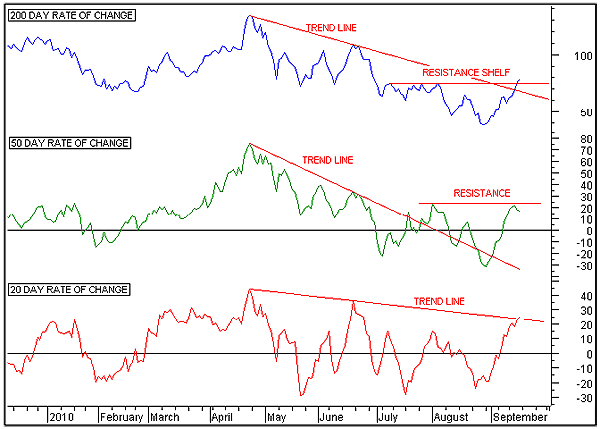
| Figure 2 shows price momentum in three time frames. The top panel shows the long-term price momentum that compares the current price to price of 200 days ago. As long as the momentum of price remains above zero, price remains higher than it was 200 days ago. One method of determining if price is in a long-term uptrend is to determine if price is higher than it was 200 days ago. However, in looking at the long term, I see that price momentum has been in a downtrend since mid-April 2010. This downtrend indicates that the difference between the price level of AAPL compared to its price level of 200 days ago has been shrinking since mid-April and is known as price deceleration. Price deceleration normally occurs near market tops and is an indication that price is starting the process of rolling over to the downside. More recently, price momentum has broken out above its downsloping trendline, signaling that the long-term momentum of price is starting to accelerate once again. Further, price momentum has also broken out above the resistance shelf formed in July. This breakout signals the end of the downward price momentum trend and the beginning of a new uptrend. Confirmation of the new uptrend will come once price momentum forms a new higher low followed by a new higher high. As long as price acceleration continues, price should continue to move higher, keeping the long-term uptrend in price intact. To get a better idea if price acceleration is going to continue, we need to look at the momentum of price in the shorter time frames. Looking at the middle panel of Figure 2, I see the intermediate-term trend of price momentum. The intermediate-term trend of price momentum is determined by comparing the current price with the price of 50 days ago. Here I see that the intermediate-term price momentum trend has been in the downward direction since mid-April 2010. This indicates a deceleration of price over the intermediate-term trend. More recently, I see that price momentum has broken out above its downsloping trendline, signaling the end of the downtrend at the intermediate-term level. However, price momentum has not yet broken out above the last lower high of the downtrend and as such has not signaled a reversal in trend (see red horizontal resistance line). This leaves price momentum in a trading range, which normally results in the continuation of the downtrend at some later date. In the bottom panel of Figure 2, I see the short-term trend of price momentum. The short-term trend is determined by comparing the current price with what it was 20 days ago. Here I see price momentum as having rallied up to its short-term downward trendline. Since overhead trendlines are dynamic resistance lines, I expect price momentum to turn back down, signaling that price momentum is continuing to decelerate. |

|
| FIGURE 2: AAPL, DAILY. The chart shows rate of change indicator in three different time frames. The rate of change indicator is a measure of price momentum. |
| Graphic provided by: MetaStock. |
| |
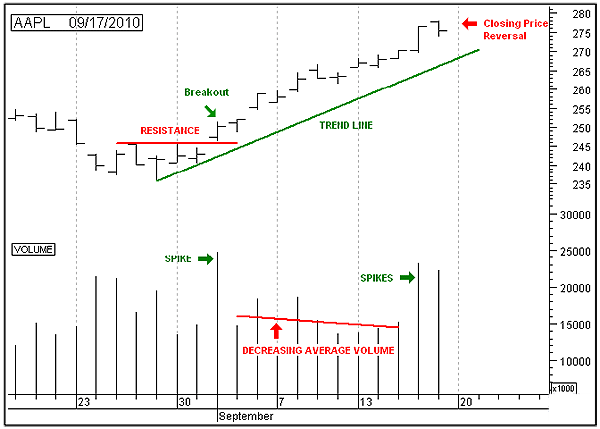
| Figure 3 shows the price bars of the most recent upward price rally from late August 2010 in the upper panel and daily volume in the lower panel. Volume is often the forgotten indicator in technical analysis. When used, volume tells us a lot about the current price rally of the current price decline. Looking at volume, I see a volume spike when price broke out above the resistance line at the beginning of the upward rally. High volume on price breakouts tells us that a price rally has gotten under way. During the following nine-day rally, I see the average level of volume shrink. The downsloping line representing a decrease in the average volume level was drawn using linear regression. Decreasing volume during a price rally is an indication that the rally is corrective in nature and not part of a sustainable uptrend. The last two volume spikes represent a buying climax. A buying climax occurs when everyone turns bullish. As a result, there are no buyers left to continue pushing price higher. |

|
| FIGURE 3: AAPL, DAIL. Chart shows the price in top panel and volume in bottom panel. |
| Graphic provided by: MetaStock. |
| |
| The upper panel of Figure 3 also shows that the last price bar has formed a closing price reversal pattern. A closing price reversal pattern is formed when after a long upward price rally the day opens at or near the high of the trading session and closes near or at the low of the session and also below the close of the previous day. Closing price reversal patterns are normally very strong reversal signals and coupled with above-average volume most likely is signaling a reversal downward. |
| In conclusion, Apple looks to be forming a price top. The momentum of price continues to decelerate, which normally occurs near a price top. Unless the momentum of price starts to accelerate again, price will ultimately turn down. Volume has decreased during the most recent rally, indicating that the rally is corrective. Volume is therefore signaling that ultimately price will turn downward. The last two volume spikes are indicative of the end of a rally and as such is signaling that Apple is ready to turn downward. The final price bar has formed a closing price reversal bar signaling that price is now reversing to the downside. All indications show that price is ready to move lower. At this point, I would not add a new long position in Apple to my portfolio. However, it is still too early to add a short position. Before adding a short position, I want to see evidence that price has turned down. |
Alan Northam lives in the Dallas, Texas area and as an electronic engineer gave him an analytical mind from which he has developed a thorough knowledge of stock market technical analysis. His abilities to analyze the future direction of the stock market has allowed him to successfully trade of his own portfolio over the last 30 years. Mr. Northam is now retired and trading the stock market full time. You can reach him at inquiry@tradersclassroom.com or by visiting his website at http://www.tradersclassroom.com. You can also follow him on Twitter @TradersClassrm.
| Garland, Tx | |
| Website: | www.tradersclassroom.com |
| E-mail address: | inquiry@tradersclassroom.com |
Click here for more information about our publications!
PRINT THIS ARTICLE

Request Information From Our Sponsors
- StockCharts.com, Inc.
- Candle Patterns
- Candlestick Charting Explained
- Intermarket Technical Analysis
- John Murphy on Chart Analysis
- John Murphy's Chart Pattern Recognition
- John Murphy's Market Message
- MurphyExplainsMarketAnalysis-Intermarket Analysis
- MurphyExplainsMarketAnalysis-Visual Analysis
- StockCharts.com
- Technical Analysis of the Financial Markets
- The Visual Investor
- VectorVest, Inc.
- Executive Premier Workshop
- One-Day Options Course
- OptionsPro
- Retirement Income Workshop
- Sure-Fire Trading Systems (VectorVest, Inc.)
- Trading as a Business Workshop
- VectorVest 7 EOD
- VectorVest 7 RealTime/IntraDay
- VectorVest AutoTester
- VectorVest Educational Services
- VectorVest OnLine
- VectorVest Options Analyzer
- VectorVest ProGraphics v6.0
- VectorVest ProTrader 7
- VectorVest RealTime Derby Tool
- VectorVest Simulator
- VectorVest Variator
- VectorVest Watchdog
