HOT TOPICS LIST
- MACD
- Fibonacci
- RSI
- Gann
- ADXR
- Stochastics
- Volume
- Triangles
- Futures
- Cycles
- Volatility
- ZIGZAG
- MESA
- Retracement
- Aroon
INDICATORS LIST
LIST OF TOPICS
PRINT THIS ARTICLE
by Chaitali Mohile
The breakout of Brookfield Asset Management shows a reluctance to surge higher.
Position: N/A
Chaitali Mohile
Active trader in the Indian stock markets since 2003 and a full-time writer. Trading is largely based upon technical analysis.
PRINT THIS ARTICLE
BREAKOUTS
BAM Holds Back The Breakout Rally
09/20/10 12:46:11 PMby Chaitali Mohile
The breakout of Brookfield Asset Management shows a reluctance to surge higher.
Position: N/A
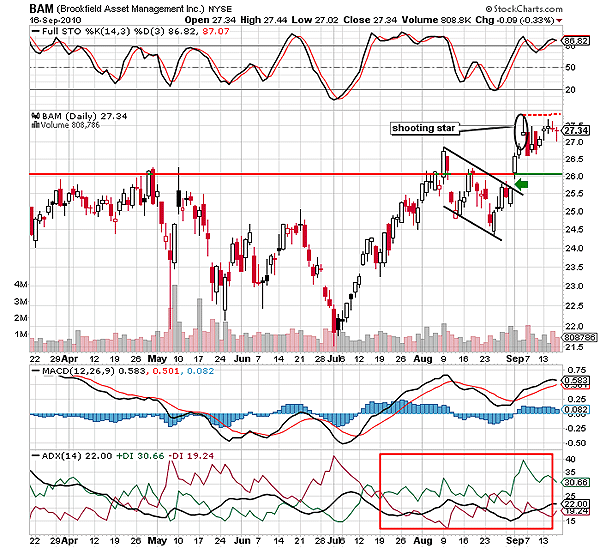
| Brookfield Asset Management (BAM) has been very volatile since April 2010. The daily chart of BAM is filled with long bearish candles (red), doji, and bullish candles (white) along with long upper and lower shadows. The shadows signify lack of strength to sustain near the day's high or low. Figure 1 reflects equal bullish and bearish force on the rallies in upward as well as downward directions. For BAM, $26 has been the strongest resistance, which was challenged many times. The shaky movements of the full stochastic (14,3,3) and moving average convergence/divergence(MACD) (12,26,9) also indicate the volatility and flickering momentum in price action. |

|
| FIGURE 1: BAM, DAILY. The intraday high marked by the shooting star candlestick pattern is an intermediate resistance of the breakout rally. The group of doji recently formed by BAM shows the hesitation to breach the immediate resistance. |
| Graphic provided by: StockCharts.com. |
| |
| The converging positive directional index (+DI) and negative directional index (-DI) of the average directional index (ADX) (14) indicates unstable trends. The ADX line failed to stabilize above the 20 levels, and as a result, neither of the trends could develop. The descending consolidation in August 2010 marked in Figure 1 was filled with bearish candles, dojis as well as gap downs. Hence, the volatility clouds are overcast on BAM. Ultimately, the resistance at 26 levels was breached with good volume. |
| After resistance converted to support, BAM surged to $27 but turned sideways. We can see a shooting star candlestick formation in Figure 1. This is a bearish formation that restricts the bullish rally. On the daily chart we can see that the high made by the shooting star (upper shadow) has developed an intermediate resistance for the breakout journey. Therefore, the rally is likely to move sideways with newly formed support at $26 and the candlestick high (shooting star) as resistance. The red box in the ADX (14) shows that the buying pressure (+DI) has surged, indicating a newly developing uptrend. |

|
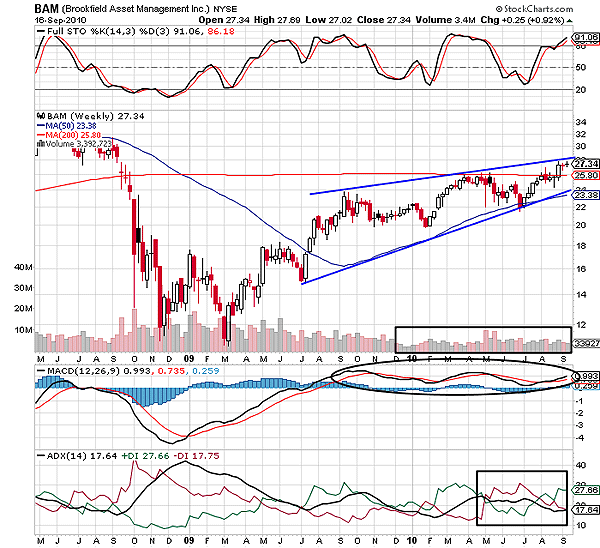
| FIGURE 2: BAM, WEEKLY. The converging trendlines are narrowing the trading range of the stock. |
| Graphic provided by: StockCharts.com. |
| |
| BAM is ascending by forming higher highs and higher lows. The two converging trendline in Figure 2 have formed a rising wedge -- a bearish formation. The trading range has narrowed due to the higher highs and lows. Since the distance between the two trendlines is relatively wide, the pattern has not yet matured to undergo a bearish breakout. The rising wedge has breached the 200-day MA resistance and has established new support at $25.80. After the breakout of the 200-day MA, BAM immediately formed two dojis, suggesting the possibility of consolidation before hitting a new high. The ADX (14) at 17 with tangled +DI and -DI confirms the possibility of sideways price action. |
| The MACD (12,26,9) is constantly changing its direction in positive territory. Thus, the breakout of the 200-day MA resistance and support-resistance line is engulfed by high volatility, resulting in the consolidation. |
Active trader in the Indian stock markets since 2003 and a full-time writer. Trading is largely based upon technical analysis.
| Company: | Independent |
| Address: | C1/3 Parth Indraprasth Towers. Vastrapur |
| Ahmedabad, Guj 380015 | |
| E-mail address: | chaitalimohile@yahoo.co.in |
Traders' Resource Links | |
| Independent has not added any product or service information to TRADERS' RESOURCE. | |
Click here for more information about our publications!
PRINT THIS ARTICLE

Request Information From Our Sponsors
- StockCharts.com, Inc.
- Candle Patterns
- Candlestick Charting Explained
- Intermarket Technical Analysis
- John Murphy on Chart Analysis
- John Murphy's Chart Pattern Recognition
- John Murphy's Market Message
- MurphyExplainsMarketAnalysis-Intermarket Analysis
- MurphyExplainsMarketAnalysis-Visual Analysis
- StockCharts.com
- Technical Analysis of the Financial Markets
- The Visual Investor
- VectorVest, Inc.
- Executive Premier Workshop
- One-Day Options Course
- OptionsPro
- Retirement Income Workshop
- Sure-Fire Trading Systems (VectorVest, Inc.)
- Trading as a Business Workshop
- VectorVest 7 EOD
- VectorVest 7 RealTime/IntraDay
- VectorVest AutoTester
- VectorVest Educational Services
- VectorVest OnLine
- VectorVest Options Analyzer
- VectorVest ProGraphics v6.0
- VectorVest ProTrader 7
- VectorVest RealTime Derby Tool
- VectorVest Simulator
- VectorVest Variator
- VectorVest Watchdog
