HOT TOPICS LIST
- MACD
- Fibonacci
- RSI
- Gann
- ADXR
- Stochastics
- Volume
- Triangles
- Futures
- Cycles
- Volatility
- ZIGZAG
- MESA
- Retracement
- Aroon
INDICATORS LIST
LIST OF TOPICS
PRINT THIS ARTICLE
by Chaitali Mohile
Cisco Systems appears to be facing more weakness in the near future.
Position: N/A
Chaitali Mohile
Active trader in the Indian stock markets since 2003 and a full-time writer. Trading is largely based upon technical analysis.
PRINT THIS ARTICLE
CHART ANALYSIS
Cisco Continues To Flow Down
09/17/10 12:14:42 PMby Chaitali Mohile
Cisco Systems appears to be facing more weakness in the near future.
Position: N/A
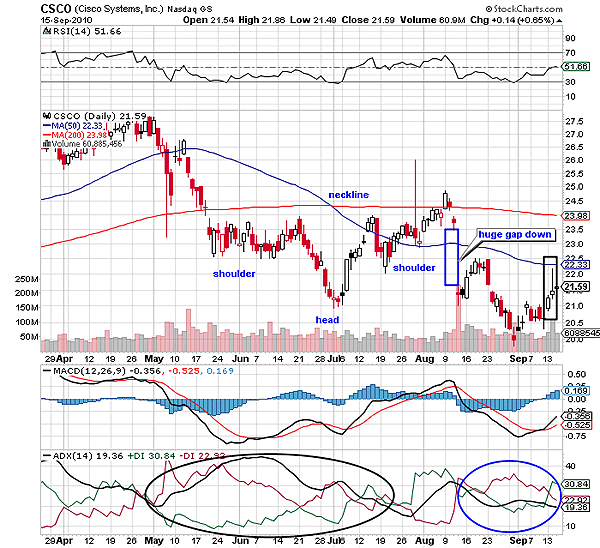
| Cisco Systems (CSCO) formed an inverted head & shoulder bullish trend reversal pattern with the 200-day moving average (MA) as its neckline on the daily chart in Figure 1. An overheated uptrend reversed, indicating the possibility of a new bullish breakout of the pattern. Although the uptrend was developing during the breakout, the surging selling pressure dragged down the price levels from the 200-day MA resistance. CSCO gapped down from $23.50 to $21.50, highlighting the weakness in the breakout rally as well as the increasing bearish strength. |
| Due to the gap down, the moving average convergence/divergence (MACD) (12,26,9) that had marginally moved in positive territory retraced back into negative region. The relative strength index (RSI) (14) breached the support line at 50, suggesting a lack of bullish strength. In addition, the gap down converted the 50-day moving average (MA) support to resistance. Under this newly formed resistance power, CSCO lost few more points by drifting to $20. However, an oversold RSI (14) and the bullish crossover of the MACD (12,26,9) in negative territory initiated a fresh pullback rally from the new low at $20 with the 50-day MA resistance as the potential target. |

|
| FIGURE 1: CSCO, DAILY |
| Graphic provided by: StockCharts.com. |
| |
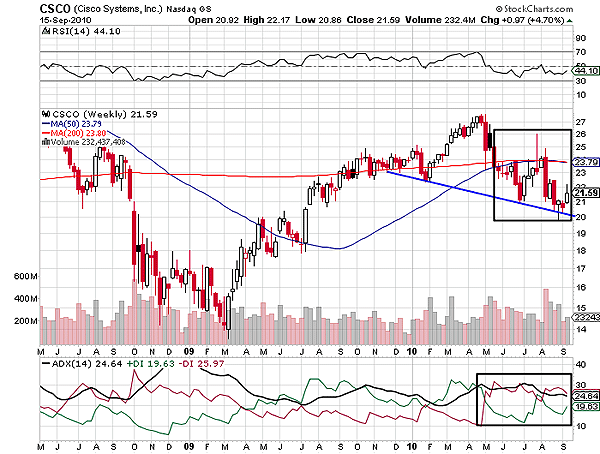
| The black box in Figure 2 shows a strong bullish candle followed by a shooting star candlestick pattern. The shooting star suggested the end of the current relief rally and a reluctance to breach the 50-day MA resistance. The average directional index (ADX) (14) turned weaker with a marginal increase in buying pressure. Under such conditions, the stock would turn volatile below the MA resistance. |

|
| FIGURE 2: CSCO, WEEKLY |
| Graphic provided by: StockCharts.com. |
| |
| Forming lower lows is a sign of weakness. On the weekly time frame, CSCO has formed a series of lower lows (see the blue trendline). The stock could not sustain the new high at $27 and tumbled below the 200-day MA support. Recently, the stock is ready to surge with the support of the descending trendline. However, the RSI (14) and the ADX (14) have not turned bullish to continue the upward price rally. The stock would hit the 200-day MA resistance only if the new uptrend is developed with healthy bullish strength. The bearish force at $23 would be pretty robust as both the MAs have converged at similar levels; therefore, breaching this level would be tougher for CSCO. |
| Thus, CSCO looks as if it will remain weak and range-bound between $21 and $23 for the short-term. |
Active trader in the Indian stock markets since 2003 and a full-time writer. Trading is largely based upon technical analysis.
| Company: | Independent |
| Address: | C1/3 Parth Indraprasth Towers. Vastrapur |
| Ahmedabad, Guj 380015 | |
| E-mail address: | chaitalimohile@yahoo.co.in |
Traders' Resource Links | |
| Independent has not added any product or service information to TRADERS' RESOURCE. | |
Click here for more information about our publications!
PRINT THIS ARTICLE

Request Information From Our Sponsors
- StockCharts.com, Inc.
- Candle Patterns
- Candlestick Charting Explained
- Intermarket Technical Analysis
- John Murphy on Chart Analysis
- John Murphy's Chart Pattern Recognition
- John Murphy's Market Message
- MurphyExplainsMarketAnalysis-Intermarket Analysis
- MurphyExplainsMarketAnalysis-Visual Analysis
- StockCharts.com
- Technical Analysis of the Financial Markets
- The Visual Investor
- VectorVest, Inc.
- Executive Premier Workshop
- One-Day Options Course
- OptionsPro
- Retirement Income Workshop
- Sure-Fire Trading Systems (VectorVest, Inc.)
- Trading as a Business Workshop
- VectorVest 7 EOD
- VectorVest 7 RealTime/IntraDay
- VectorVest AutoTester
- VectorVest Educational Services
- VectorVest OnLine
- VectorVest Options Analyzer
- VectorVest ProGraphics v6.0
- VectorVest ProTrader 7
- VectorVest RealTime Derby Tool
- VectorVest Simulator
- VectorVest Variator
- VectorVest Watchdog
