HOT TOPICS LIST
- MACD
- Fibonacci
- RSI
- Gann
- ADXR
- Stochastics
- Volume
- Triangles
- Futures
- Cycles
- Volatility
- ZIGZAG
- MESA
- Retracement
- Aroon
INDICATORS LIST
LIST OF TOPICS
PRINT THIS ARTICLE
by Koos van der Merwe
You have to be strong to buy when prices are bad.
Position: Accumulate
Koos van der Merwe
Has been a technical analyst since 1969, and has worked as a futures and options trader with First Financial Futures in Johannesburg, South Africa.
PRINT THIS ARTICLE
FLAGS AND PENNANTS
Are You Looking For A Bank To Buy?
09/16/10 08:13:39 AMby Koos van der Merwe
You have to be strong to buy when prices are bad.
Position: Accumulate
| Banks are slowly starting to recover the blue-chip status they once had. Governments are stepping in with rules and regulations that need to be followed to bring a bank back to the high-security image they once had -- you know, protect your hard-earned money by putting it in your bank, not your mattress. We all know about Morgan Stanley, Bank of America, and Citigroup, to name a few major US banks, and the new restrictions they have to face to clean up their mess, but what about European banks, where the political scene allows for the adoption of government regulation far quicker than in the US? Barclays Bank (BCS) defines itself as "a global financial services provider, engaged in retail and commercial banking, credit cards, investment banking, wealth management and investment management services all over the world," and indeed, their name was synonymous with safety and security in the banking industry, but like all the banks throughout the world, greed and risk-taking destroyed that image. The plus in its favor is that it rejected the British government's offer of capital to help it through the crisis. With the new banking regulations in Europe and their own ability to survive, they may indeed be a stock worth looking at for a long-term investment. |

|
| FIGURE 1: BARCLAYS, WEEKLY |
| Graphic provided by: AdvancedGET. |
| |
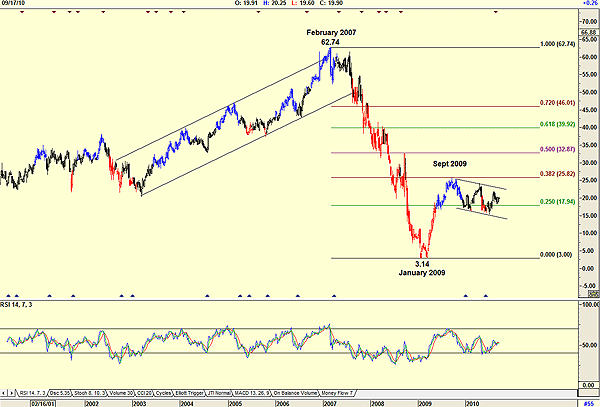
| Figure 1 shows how the share price of its ADR listed on the NYSE fell from a high of $62.74 in February 2007 to a low of $3.14. It then rose to test the 38.2% Fibonacci retracement level of $25.82 by September 2009. Since then, it has drifted lower to its present price of $19.90 in what appears to be a flag pattern formation. |

|
| FIGURE 2: BARCLAYS, DAILY |
| Graphic provided by: AdvancedGET. |
| |
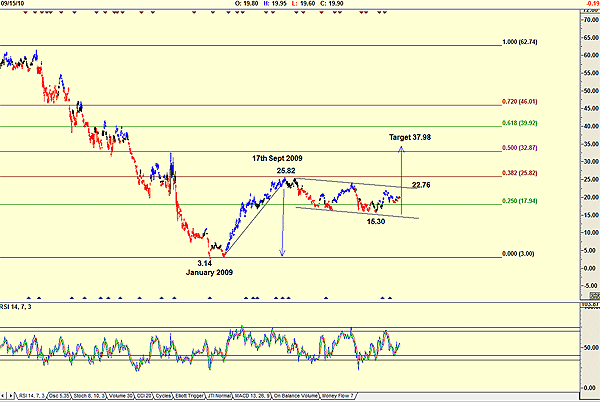
| Figure 2 shows the flag pattern and suggests a target of $37.98 (25.82 - 3.14 = 22.68 + 15.30 = 37.98) between the 50% and 68.2% Fibonacci levels. The relative strength index (RSI) gave a buy signal when the price was $15.30, and although it rose and fell, it did not give a convincing sell signal. The resistance trendline is suggesting that any move above $22.76 would be a strong buy signal, but investors who are prepared to take greater risk could accumulate the share at present levels. Barclays Bank (BCS) is definitely a share worth buying and holding for the long term. |
Has been a technical analyst since 1969, and has worked as a futures and options trader with First Financial Futures in Johannesburg, South Africa.
| Address: | 3256 West 24th Ave |
| Vancouver, BC | |
| Phone # for sales: | 6042634214 |
| E-mail address: | petroosp@gmail.com |
Click here for more information about our publications!
PRINT THIS ARTICLE

Request Information From Our Sponsors
- StockCharts.com, Inc.
- Candle Patterns
- Candlestick Charting Explained
- Intermarket Technical Analysis
- John Murphy on Chart Analysis
- John Murphy's Chart Pattern Recognition
- John Murphy's Market Message
- MurphyExplainsMarketAnalysis-Intermarket Analysis
- MurphyExplainsMarketAnalysis-Visual Analysis
- StockCharts.com
- Technical Analysis of the Financial Markets
- The Visual Investor
- VectorVest, Inc.
- Executive Premier Workshop
- One-Day Options Course
- OptionsPro
- Retirement Income Workshop
- Sure-Fire Trading Systems (VectorVest, Inc.)
- Trading as a Business Workshop
- VectorVest 7 EOD
- VectorVest 7 RealTime/IntraDay
- VectorVest AutoTester
- VectorVest Educational Services
- VectorVest OnLine
- VectorVest Options Analyzer
- VectorVest ProGraphics v6.0
- VectorVest ProTrader 7
- VectorVest RealTime Derby Tool
- VectorVest Simulator
- VectorVest Variator
- VectorVest Watchdog
