HOT TOPICS LIST
- MACD
- Fibonacci
- RSI
- Gann
- ADXR
- Stochastics
- Volume
- Triangles
- Futures
- Cycles
- Volatility
- ZIGZAG
- MESA
- Retracement
- Aroon
INDICATORS LIST
LIST OF TOPICS
PRINT THIS ARTICLE
by Austin Passamonte
The S&P 100 Index [OEX] is a great tool for measuring broad market action. Here's a look at some recent technical developments within the OEX.
Position: N/A
Austin Passamonte
Austin is a private trader who trades emini stock index futures intraday. He currently trades various futures markets from home in addition to managing a trader's educational forum
PRINT THIS ARTICLE
INDEX OPTION TRADING
OEX Monitors The Market
01/15/02 10:26:41 AMby Austin Passamonte
The S&P 100 Index [OEX] is a great tool for measuring broad market action. Here's a look at some recent technical developments within the OEX.
Position: N/A
| If I were limited to watching just one symbol for broad market action as a proxy, it would certainly be the S&P 100 index. While this market was overlooked by most of the late 1990s crowd, it was once the most popular option vehicle traded. It has regained much of the volume that briefly departed to chase the tech sector's now flat or non-existant bubble. One hundred of the key corporations representing all major sectors comprise its makeup. |
| It is a symbol that behaves in a very orderly fashion compared to many other markets, and also offers key insight to broad market direction with less random noise. |

|
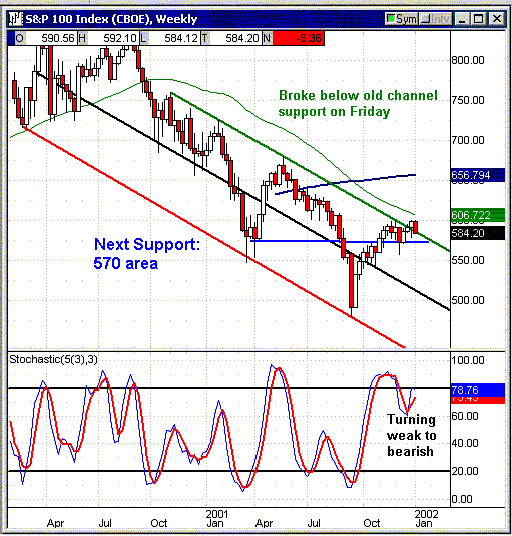
| Figure 1: Weekly chart: OEX |
| Graphic provided by: Quote.com. |
| Graphic provided by: QCharts. |
| |
| Notice how the OEX has remained within a sembalance of a regression channel for nearly two years now. A recent break above resistance the first week of this year quickly reversed the week after. From here we can begin to identify key action points in the market. Support lies near the 570 area and resistance lowers at the 50-DMA (light green) and descending channel upper line (solid green). The mid-channel line (black) would be our next key area of support should the present selloff continue for some time. |
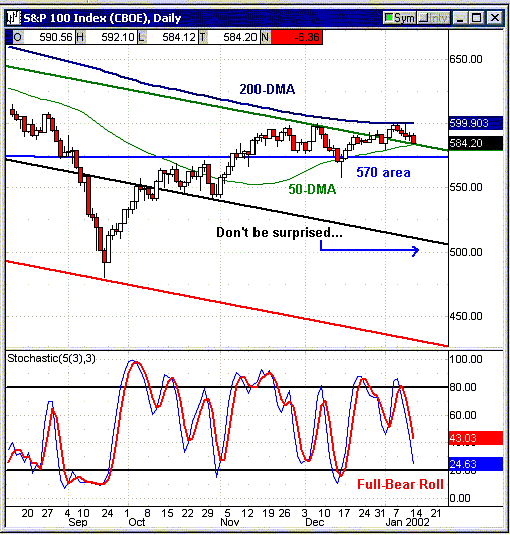
 Figure 2: Daily chart: OEX Dialing down the time frame of this same weekly chart to daily mode shows us right where those channel lines have acted as price magnets. If the 575 area fails to hold (blue line) we must look towards 550 area as next firm support. It was a key measure through much of 2001 and will act like gravity on price action flailing below 575. Stochastic values in mid-decline suggest further weakness past Friday's close as well. Many traders focus exclusively on the OEX for options and/or OEX iShares trading, but even for those who don't it may offer the best overall proxy in my opinion for any broad market assessment. Considering the OEX also serves as the underlying basis for the volatility index (VIX) measurement, it certainly merits every trader following price action as a gauge to assess what may happen next! |
Austin is a private trader who trades emini stock index futures intraday. He currently trades various futures markets from home in addition to managing a trader's educational forum
| Title: | Individual Trader |
| Company: | CoiledMarkets.com |
| Address: | PO Box 633 |
| Naples, NY 14512 | |
| Website: | coiledmarkets.com/blog |
| E-mail address: | austinp44@yahoo.com |
Traders' Resource Links | |
| CoiledMarkets.com has not added any product or service information to TRADERS' RESOURCE. | |
Click here for more information about our publications!
Comments
Date: 01/18/02Rank: 4Comment:
Date: 01/22/02Rank: 5Comment:
Date: 01/22/02Rank: 5Comment:
Date: 01/22/02Rank: 4Comment:
Date: 01/24/02Rank: 5Comment: Execllent article. However, OEX is sometimes
a very difficult symbol to get a quote
for, or an options chain..

Request Information From Our Sponsors
- StockCharts.com, Inc.
- Candle Patterns
- Candlestick Charting Explained
- Intermarket Technical Analysis
- John Murphy on Chart Analysis
- John Murphy's Chart Pattern Recognition
- John Murphy's Market Message
- MurphyExplainsMarketAnalysis-Intermarket Analysis
- MurphyExplainsMarketAnalysis-Visual Analysis
- StockCharts.com
- Technical Analysis of the Financial Markets
- The Visual Investor
- VectorVest, Inc.
- Executive Premier Workshop
- One-Day Options Course
- OptionsPro
- Retirement Income Workshop
- Sure-Fire Trading Systems (VectorVest, Inc.)
- Trading as a Business Workshop
- VectorVest 7 EOD
- VectorVest 7 RealTime/IntraDay
- VectorVest AutoTester
- VectorVest Educational Services
- VectorVest OnLine
- VectorVest Options Analyzer
- VectorVest ProGraphics v6.0
- VectorVest ProTrader 7
- VectorVest RealTime Derby Tool
- VectorVest Simulator
- VectorVest Variator
- VectorVest Watchdog
