HOT TOPICS LIST
- MACD
- Fibonacci
- RSI
- Gann
- ADXR
- Stochastics
- Volume
- Triangles
- Futures
- Cycles
- Volatility
- ZIGZAG
- MESA
- Retracement
- Aroon
INDICATORS LIST
LIST OF TOPICS
PRINT THIS ARTICLE
by Billy Williams
Chart patterns in a major index can give you the green light for buying stocks that are pulling back.
Position: Buy
Billy Williams
Billy Williams has been trading the markets for 27 years, specializing in momentum trading with stocks and options.
PRINT THIS ARTICLE
MOVING AVERAGES
Pullback Trading Using Market Momentum
09/14/10 09:25:00 AMby Billy Williams
Chart patterns in a major index can give you the green light for buying stocks that are pulling back.
Position: Buy
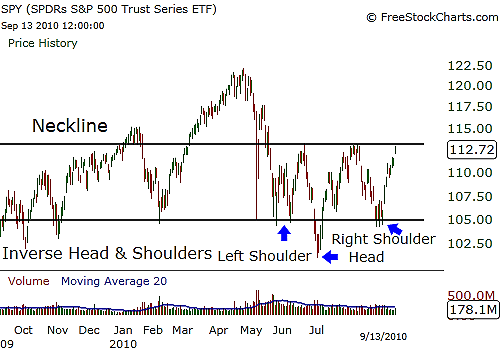
| The market had been grinding back and forth with no clear indication of direction, but lately, the market has confirmed an uptrend in the Standard & Poor's 500 with the exchange traded fund (ETF) version, forming a bottoming pattern. The inverse head & shoulders pattern is a bottoming formation that reveals that the bears may be losing control of a security, with volume drying up as sellers sit back on the sidelines as the buyers begin to cautiously enter the market. It first occurs as the security, in this case SPY, begins the steady decline downward while forming lower highs and lower lows in price. Then the SPY will begin to trade upward, near the last significant price high before trading downward again. The next low must be lower than the previous price low. When that happens, the left shoulder of the pattern will be formed and the head portion will form as price trades upward from the new price low point and upward to the previous price high. Now, SPY's price action will trade downward but be unable to reach the previous low point in price because the selling volume is drying up. |

|
| FIGURE 1: SPY. The SPY forms an inverse head & shoulders pattern, which, if traded past the neckline, reveals a price reversal to the upside. |
| Graphic provided by: www.freestockcharts.com. |
| |
| The bearish trend is running its course and sellers are exiting the market as the bulls begin to enter the market and the buying frenzy begins. Draw a trendline between the two previous significant price highs and this will be the neckline of the inverse head & shoulders pattern and will be the trigger point for your entry and/or confirmation of a momentum shifting into a reversal as price trades through this point on higher volume. At this point, you can trade the ETF or the index, but you could also use this as an indicator of momentum shifting in the market to the upside, then begin looking for entries in individual stocks -- preferably, stocks that have maintained their highs even as the market overall has exhibited weakness. See Figure 1. |

|
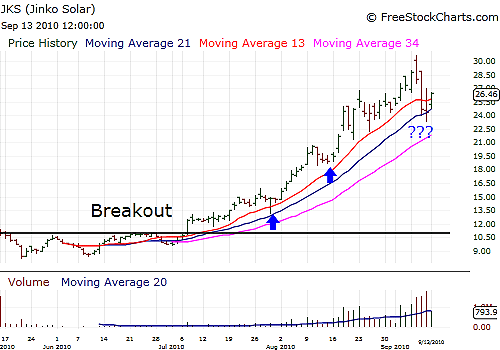
| FIGURE 2: JKS. JKS has been in a strong trend with small pullbacks in price for easy entries into a fast-moving stock. |
| Graphic provided by: www.freestockcharts.com. |
| |
| Target strong stocks that have solid fundamentals but, more important, have traded near their five-year highs. Black Star Funds revealed in their report "Does Trend Following Work On Stocks?" that stocks that have been found to consistently outperform other stocks based solely on one trait: they are trading at all-time highs in price action. See Figure 2. With the major index confirming an uptrend, looking for stocks that are trading near their all-time highs provides the perfect setup for a low risk trade. Waiting for a pullback in price at this point provides a low risk setup for a smart trader. |

|
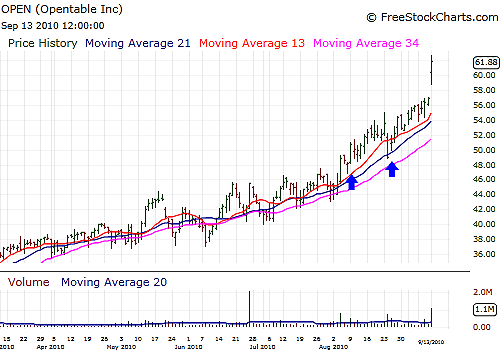
| FIGURE 3: OPEN. OPEN is another stock with strong momentum to the upside with low-risk pullbacks in price. |
| Graphic provided by: www.freestockcharts.com. |
| |
| Use 13-, 21-, and 34-day simple moving averages (SMA) to help you time your entry. For long positions, you want to watch for SMAs to be in the right order, with the 13-day trading over the 21-day and the 21-day trading over the 34-day. When price pulls back, it can trade through the 13-day and the 21-day as long as it doesn't trade through the 34-day; otherwise, the setup is void. Take note of the price bar that sets the low and enter the trade as it trades over the high of that bar and set your stop below the low. See Figure 3. When price reaches three times your initial risk, sell half your position, and use the price reading of the 34-day SMA as a trailing stop. If price hits the 34-day SMA, sell off the other half of your position and exit your position but continue to adjust your stop if the stock trades higher to put yourself in a position to profit handsomely if the position turns into a home run. |
Billy Williams has been trading the markets for 27 years, specializing in momentum trading with stocks and options.
| Company: | StockOptionSystem.com |
| E-mail address: | stockoptionsystem.com@gmail.com |
Traders' Resource Links | |
| StockOptionSystem.com has not added any product or service information to TRADERS' RESOURCE. | |
Click here for more information about our publications!
PRINT THIS ARTICLE

Request Information From Our Sponsors
- VectorVest, Inc.
- Executive Premier Workshop
- One-Day Options Course
- OptionsPro
- Retirement Income Workshop
- Sure-Fire Trading Systems (VectorVest, Inc.)
- Trading as a Business Workshop
- VectorVest 7 EOD
- VectorVest 7 RealTime/IntraDay
- VectorVest AutoTester
- VectorVest Educational Services
- VectorVest OnLine
- VectorVest Options Analyzer
- VectorVest ProGraphics v6.0
- VectorVest ProTrader 7
- VectorVest RealTime Derby Tool
- VectorVest Simulator
- VectorVest Variator
- VectorVest Watchdog
- StockCharts.com, Inc.
- Candle Patterns
- Candlestick Charting Explained
- Intermarket Technical Analysis
- John Murphy on Chart Analysis
- John Murphy's Chart Pattern Recognition
- John Murphy's Market Message
- MurphyExplainsMarketAnalysis-Intermarket Analysis
- MurphyExplainsMarketAnalysis-Visual Analysis
- StockCharts.com
- Technical Analysis of the Financial Markets
- The Visual Investor
