HOT TOPICS LIST
- MACD
- Fibonacci
- RSI
- Gann
- ADXR
- Stochastics
- Volume
- Triangles
- Futures
- Cycles
- Volatility
- ZIGZAG
- MESA
- Retracement
- Aroon
INDICATORS LIST
LIST OF TOPICS
PRINT THIS ARTICLE
by Koos van der Merwe
When in doubt, buy gold.
Position: Accumulate
Koos van der Merwe
Has been a technical analyst since 1969, and has worked as a futures and options trader with First Financial Futures in Johannesburg, South Africa.
PRINT THIS ARTICLE
TRIANGLES
Which Way Goes StreetTracks Gold?
09/13/10 09:42:17 AMby Koos van der Merwe
When in doubt, buy gold.
Position: Accumulate
| With the talk of a double-dip recession being promoted by Republicans and bears, market players have been moving to gold shares as a hedge rather than hide their money in the mattress of their beds. (Banks are too risky; they have shown us that.) With the market starting to turn decidedly bullish, what does the future look like for gold? To give us direction as to where gold is going, I have analyzed the chart of StreetTracks Gold. |

|
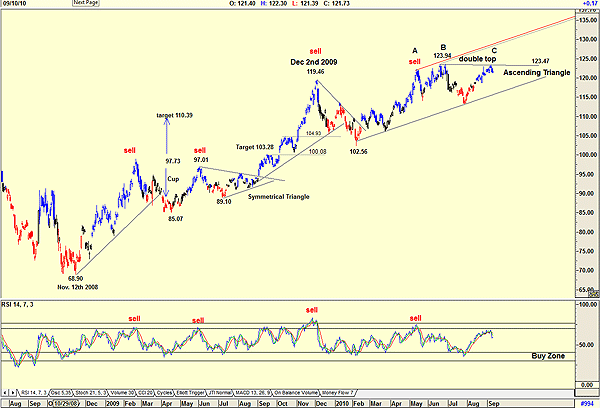
| FIGURE 1: STREETTRACKS GOLD, DAILY |
| Graphic provided by: AdvancedGET. |
| |
| From November 12, 2008, the share price started moving up from a low of $68.90 and formed a cup & handle formation that gave a target of $110.93 (Figure 1). The price then moved into a symmetrical triangle formation before reaching the target of $110.39. The symmetrical target formation gave a target of $103.28. Of course, the target of $110.39 is more acceptable. As you can see on the chart, the price moved to $100.08, then corrected; moved to $104.93 and once again corrected, and then moved up to a high of $119.46 by December 2, 2009, before correcting to $102.56. In all the corrections, the relative strength index (RSI) gave sell signals. What is the chart telling us now? On one hand, the chart is suggesting an ascending triangle formation, with a possible target of $145.32 (123.94 - 102.56 = 21.38 + 123.94 = 145.32). On the other hand, it is suggesting a double top, shown by B and C and a possible triple top, shown by A,B, and C. Note that the RSI has not given a sell signal, suggesting that the target of the ascending triangle is a more definite result. With the shares of StreetTracks gold leaning more toward an upward move than a downward correction, by all accounts, the Dow Jones Industrial Average and the Standard & Poor's 500 should correct downward. However, uncertainty does exist. As an example, I offer the chart below (Figure 2). |

|
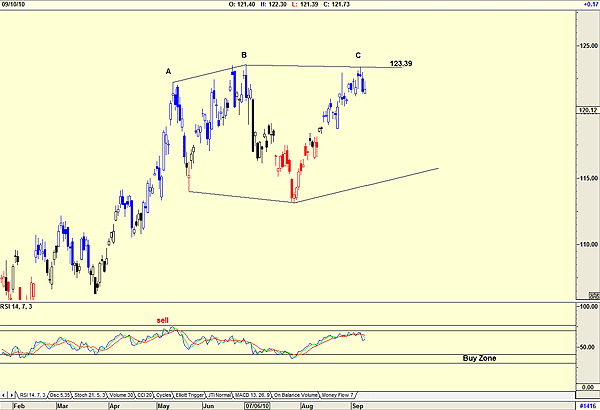
| FIGURE 2: STREETTRACKS GOLD, DAILY. This daily chart shows a possible diamond formation. |
| Graphic provided by: AdvancedGET. |
| |
| Figure 2 suggests that a diamond formation could be developing. Diamond formations suggest uncertainty. A move above $123.39 would shatter this suggestion and confirm the ascending triangle target of $145.32. |

|
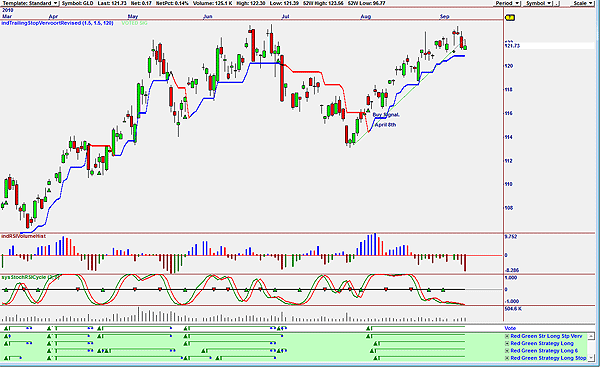
| FIGURE 3: GOLD. This chart suggests strength. |
| Graphic provided by: OmniTrader. |
| |
| Figure 3 uses the red-green strategy. The chart shows that a buy signal was given on April 8, and that it is still in force. The chart also shows that both the RSI volume and the stochastic RSI cycle indicators are both oversold. The chart is suggesting that a buy signal could be given in the near future. To conclude, StreetTracks gold is suggesting uncertainty as to whether to buy gold shares, whether the market is truly in a new bull market. All my forecasts show that a new bull market is in force; however, the chart of StreetTracks Gold is telling us that with every correction in a bull market, money will move to gold. |
Has been a technical analyst since 1969, and has worked as a futures and options trader with First Financial Futures in Johannesburg, South Africa.
| Address: | 3256 West 24th Ave |
| Vancouver, BC | |
| Phone # for sales: | 6042634214 |
| E-mail address: | petroosp@gmail.com |
Click here for more information about our publications!
PRINT THIS ARTICLE

Request Information From Our Sponsors
- StockCharts.com, Inc.
- Candle Patterns
- Candlestick Charting Explained
- Intermarket Technical Analysis
- John Murphy on Chart Analysis
- John Murphy's Chart Pattern Recognition
- John Murphy's Market Message
- MurphyExplainsMarketAnalysis-Intermarket Analysis
- MurphyExplainsMarketAnalysis-Visual Analysis
- StockCharts.com
- Technical Analysis of the Financial Markets
- The Visual Investor
- VectorVest, Inc.
- Executive Premier Workshop
- One-Day Options Course
- OptionsPro
- Retirement Income Workshop
- Sure-Fire Trading Systems (VectorVest, Inc.)
- Trading as a Business Workshop
- VectorVest 7 EOD
- VectorVest 7 RealTime/IntraDay
- VectorVest AutoTester
- VectorVest Educational Services
- VectorVest OnLine
- VectorVest Options Analyzer
- VectorVest ProGraphics v6.0
- VectorVest ProTrader 7
- VectorVest RealTime Derby Tool
- VectorVest Simulator
- VectorVest Variator
- VectorVest Watchdog
