HOT TOPICS LIST
- MACD
- Fibonacci
- RSI
- Gann
- ADXR
- Stochastics
- Volume
- Triangles
- Futures
- Cycles
- Volatility
- ZIGZAG
- MESA
- Retracement
- Aroon
INDICATORS LIST
LIST OF TOPICS
PRINT THIS ARTICLE
by Koos van der Merwe
Investors are worried that history will repeat itself just two years after the banking sector spectacularly imploded.
Position: Buy
Koos van der Merwe
Has been a technical analyst since 1969, and has worked as a futures and options trader with First Financial Futures in Johannesburg, South Africa.
PRINT THIS ARTICLE
FIBONACCI
Is It Time To Buy Morgan Stanley?
09/09/10 08:20:55 AMby Koos van der Merwe
Investors are worried that history will repeat itself just two years after the banking sector spectacularly imploded.
Position: Buy
| Despite the best efforts of central bankers around the world, investors fear that the credit crisis is not completely over because banks are still reluctant to lend. There are still legitimate concerns about credit quality and the toxic assets that many banks have yet to dump. We all know this. Many believe that banks were responsible in creating the present financial crisis, with the lax credit during the housing crisis; their promotion of below-grade investments in the form of mortgage-backed securities, and their risk-taking in the market as they managed hedge funds placing their own interests first. No bank escaped the fallout as the bubble they created burst, and the average investor today looks at banks with cynicism, scared to buy their shares with money they prefer to invest in GICs or government-owned bonds. Investors are angry and uncertain about the future. Of course, the rule is to buy when things are bad, buy when the stock is down, but with Lehman Brothers going into bankruptcy, and an example has been set showing that even the most sturdy of institutions can fail -- so having said all this, is it time to start putting one's cash back into bank shares? I believe it is. |

|
| FIGURE 1: MORGAN STANLEY, MONTHLY |
| Graphic provided by: AdvancedGET. |
| |
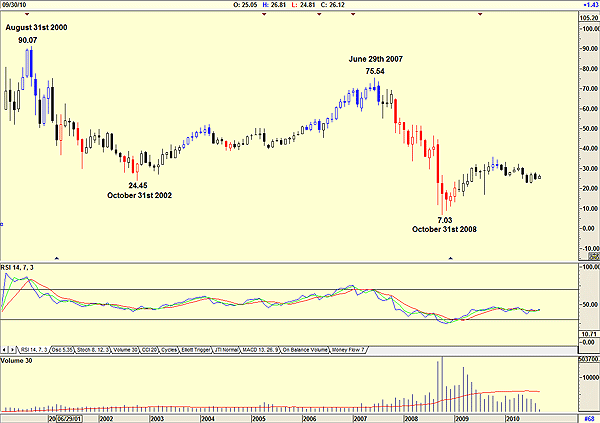
| Figure 1 is a monthly chart of Morgan Stanley and shows how the share price fell from a high of $90.07 on August 31, 2000, to a low of $7.03 by October 31, 2008, a collapse of an incredible 92%. Since then, the price has recovered to $26.12, but it still has a long way to go. Looking at the chart, the relative strength index (RSI) does look positive, although its movement appears to be more sideways than up. Volume also is below average, which is also a concern. |

|
| FIGURE 2: MORGAN STANLEY, DAILY |
| Graphic provided by: AdvancedGET. |
| |
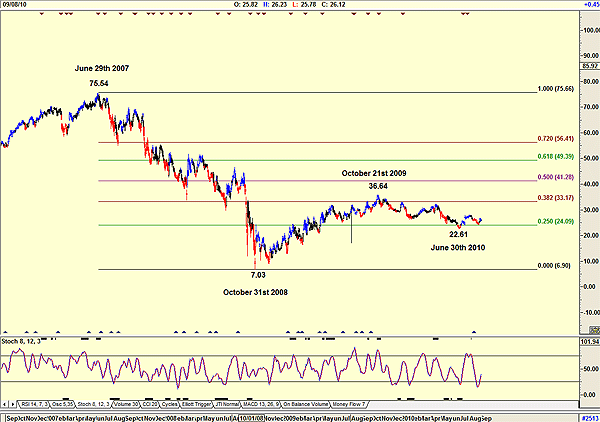
| Figure 2 is a daily chart and shows that from the low of $7.03 in October 31, 2008, the price rose to slightly above the 38.2% Fibonacci retracement level before falling back to find support at $22.61, the 25% Fibonacci level. At the moment, the price appears to be using this level as a strong support level, with the stochastic indicator (8,12,3) suggesting a buy. The upside resistance is still the 38.2% Fibonacci level at $33.17. A break above this level should see the price test all the Fibonacci levels on the way up. |

|
| FIGURE 3: MORGAN STANLEY, DAILY. Buy signals are being shown. |
| Graphic provided by: OmniTrader. |
| |
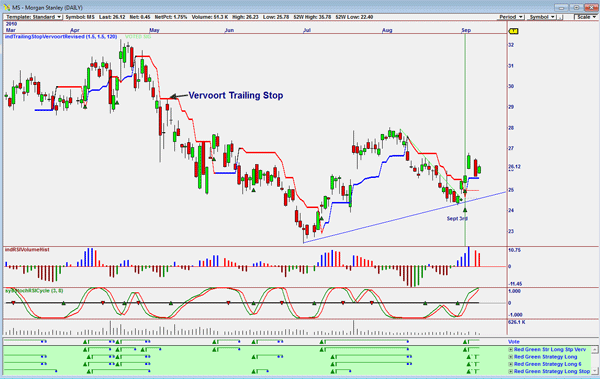
| Figure 3 shows the following: a. The price is currently above the Vervoort trailing stop, a positive sign. b. The vote line suggested a buy signal on September 3 when the price was $25.68. The strategy used is four variations of the red green strategy, which has proved very effective in calling buy signals, as you can see. c. The stochastic RSI cycle indicator is positive but close to its high, so we could see a correction in the near future. d. The negative is the RSI volume histogram indicator, which has turned negative with the fall in price on Tuesday, September 7. My previous analysis of the Standard & Poor's 500 suggests that the market is at the start of a new bull market. My analysis of Morgan Stanley suggests that the share is a buy at present levels for a long-term hold. |
Has been a technical analyst since 1969, and has worked as a futures and options trader with First Financial Futures in Johannesburg, South Africa.
| Address: | 3256 West 24th Ave |
| Vancouver, BC | |
| Phone # for sales: | 6042634214 |
| E-mail address: | petroosp@gmail.com |
Click here for more information about our publications!
PRINT THIS ARTICLE

Request Information From Our Sponsors
- VectorVest, Inc.
- Executive Premier Workshop
- One-Day Options Course
- OptionsPro
- Retirement Income Workshop
- Sure-Fire Trading Systems (VectorVest, Inc.)
- Trading as a Business Workshop
- VectorVest 7 EOD
- VectorVest 7 RealTime/IntraDay
- VectorVest AutoTester
- VectorVest Educational Services
- VectorVest OnLine
- VectorVest Options Analyzer
- VectorVest ProGraphics v6.0
- VectorVest ProTrader 7
- VectorVest RealTime Derby Tool
- VectorVest Simulator
- VectorVest Variator
- VectorVest Watchdog
- StockCharts.com, Inc.
- Candle Patterns
- Candlestick Charting Explained
- Intermarket Technical Analysis
- John Murphy on Chart Analysis
- John Murphy's Chart Pattern Recognition
- John Murphy's Market Message
- MurphyExplainsMarketAnalysis-Intermarket Analysis
- MurphyExplainsMarketAnalysis-Visual Analysis
- StockCharts.com
- Technical Analysis of the Financial Markets
- The Visual Investor
