HOT TOPICS LIST
- MACD
- Fibonacci
- RSI
- Gann
- ADXR
- Stochastics
- Volume
- Triangles
- Futures
- Cycles
- Volatility
- ZIGZAG
- MESA
- Retracement
- Aroon
INDICATORS LIST
LIST OF TOPICS
PRINT THIS ARTICLE
by Chaitali Mohile
The S&P Retail Index is undergoing huge bearish pressure. The bullish breakout may gear up a new uptrend.
Position: N/A
Chaitali Mohile
Active trader in the Indian stock markets since 2003 and a full-time writer. Trading is largely based upon technical analysis.
PRINT THIS ARTICLE
CHART ANALYSIS
S&P Retail Index Regaining Strength?
09/08/10 01:15:43 PMby Chaitali Mohile
The S&P Retail Index is undergoing huge bearish pressure. The bullish breakout may gear up a new uptrend.
Position: N/A
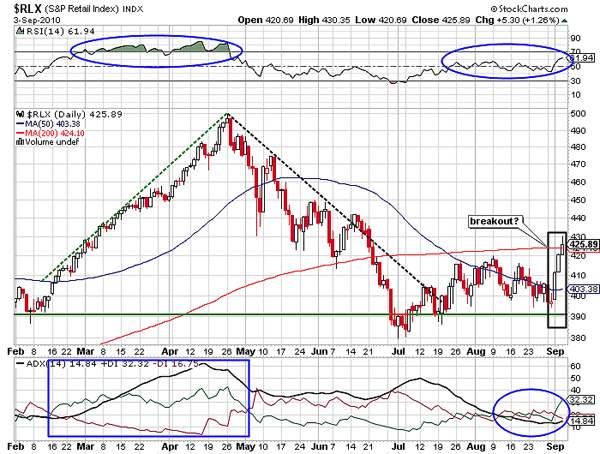
| In February 2010, the S&P Retail Index ($RLX) began a bullish move with the support of 390 levels. In Figure 1, the index marginally consolidated at 390 levels before starting the new rally. As the price surged, the fresh buying pressure flooded, developing a robust bullish trend. The relative strength index (RSI) (14) also showed bullish strength in the rally by moving above 50 levels. The RSI (14) and the average directional index (ADX) (14) turned extremely bullish, suggesting the possibility of a trend reversal. |
| $RLX plunged from 500 levels and lost the entire gains of the previous bullish rally. The index breached the 200-day moving average (MA) support, indicating emerging weakness in the rally. Later, the prior low at 390 levels was under threat, but the same was immediately converted to support very quickly. Thereafter, $RLX consolidated with the support/resistance of 390 levels and the 200-day MA, respectively. A downtrend that was developed during the descending price action reversed from 50 levels and turned weaker by drifting below the 15 levels (see Figure 1). The RSI (14) was reluctant to cross the center line at 50 levels indicating lack of strength. |

|
| FIGURE 1: $RLX, DAILY |
| Graphic provided by: StockCharts.com. |
| |
| However, the index tried to climb with the support of 400 levels. We can see in Figure 1 that the index witnessed three strong bullish sessions in the current month. All the three candles made new intraday highs and gradually converted the 200-day MA resistance to the support. But the three white soldiers candlestick pattern was not formed in Figure 1, as the third candle failed to close near the intraday high. In addition, the ADX (14) continued to remain weak, and therefore, the chart is not technically strong to undergo any bullish reversal opportunities. Traders should watch for the 200-day MA breakout along with the fresh uptrend and the RSI (14) must sustain in the bullish area above 50 levels. |
| Thus, the index is likely to consolidate near the MA resistance and can retrace marginally. Trading at the current levels would be a little choppy, but once the ongoing bearish wave is completed, $RLX would breach the resistance, opening fresh trading opportunities. |
Active trader in the Indian stock markets since 2003 and a full-time writer. Trading is largely based upon technical analysis.
| Company: | Independent |
| Address: | C1/3 Parth Indraprasth Towers. Vastrapur |
| Ahmedabad, Guj 380015 | |
| E-mail address: | chaitalimohile@yahoo.co.in |
Traders' Resource Links | |
| Independent has not added any product or service information to TRADERS' RESOURCE. | |
Click here for more information about our publications!
PRINT THIS ARTICLE

Request Information From Our Sponsors
- StockCharts.com, Inc.
- Candle Patterns
- Candlestick Charting Explained
- Intermarket Technical Analysis
- John Murphy on Chart Analysis
- John Murphy's Chart Pattern Recognition
- John Murphy's Market Message
- MurphyExplainsMarketAnalysis-Intermarket Analysis
- MurphyExplainsMarketAnalysis-Visual Analysis
- StockCharts.com
- Technical Analysis of the Financial Markets
- The Visual Investor
- VectorVest, Inc.
- Executive Premier Workshop
- One-Day Options Course
- OptionsPro
- Retirement Income Workshop
- Sure-Fire Trading Systems (VectorVest, Inc.)
- Trading as a Business Workshop
- VectorVest 7 EOD
- VectorVest 7 RealTime/IntraDay
- VectorVest AutoTester
- VectorVest Educational Services
- VectorVest OnLine
- VectorVest Options Analyzer
- VectorVest ProGraphics v6.0
- VectorVest ProTrader 7
- VectorVest RealTime Derby Tool
- VectorVest Simulator
- VectorVest Variator
- VectorVest Watchdog
