HOT TOPICS LIST
- MACD
- Fibonacci
- RSI
- Gann
- ADXR
- Stochastics
- Volume
- Triangles
- Futures
- Cycles
- Volatility
- ZIGZAG
- MESA
- Retracement
- Aroon
INDICATORS LIST
LIST OF TOPICS
PRINT THIS ARTICLE
by Billy Williams
Crowds are often wrong, particularly in the market. Use the CBOE Volatility Index to be on the right side.
Position: Buy
Billy Williams
Billy Williams has been trading the markets for 27 years, specializing in momentum trading with stocks and options.
PRINT THIS ARTICLE
VOLATILITY
Spotting Price Reversals With The VIX
09/08/10 08:17:14 AMby Billy Williams
Crowds are often wrong, particularly in the market. Use the CBOE Volatility Index to be on the right side.
Position: Buy
| The stock market can move in waves where its price action can trade into extreme price levels, resulting in waves of traders that enter or exit the market. However, it is exactly at these extreme levels that traders need to be cautious and consider short-term reversals, but crowd psychology takes over as one trader follows the other in fear of missing out on a potential move or taking a loss. Studying market psychology is really about the study of human nature as the market's price action reveals to the intelligent speculator what the market is reflecting about the market participants. For example, when markets are trending upward, it reflects that they are optimistic about the future of an investment and begin accumulating it, which causes it to rise. Conversely, if the markets are reversing, then it reveals that the mass crowd of traders participating in the markets have a negative view of current prices and/or the future prospects of the market, which causes distribution, or selling, resulting in a downtrend. |

|
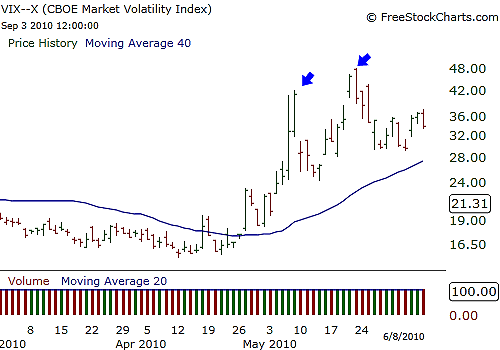
| FIGURE 1: VIX. The VIX trades far away from the 40-day SMA on May 7, 2010, and May 21, 2010, setting the stage for a reversal in the S&P 500. |
| Graphic provided by: www.freestockcharts.com. |
| |
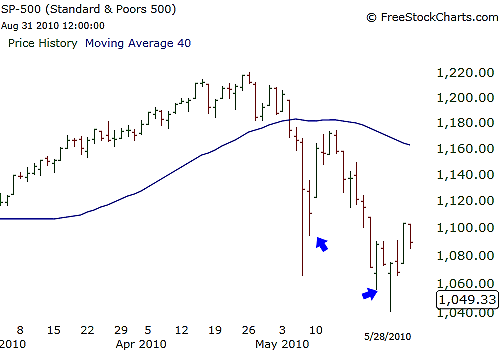
| At times, though, the market has moved too far, too fast in a given direction and reverses course. When large numbers of traders begin to enter the market and are driven by either fear or greed, taking the market to extremes, it sets the stage for a quick price reversal. These short-term reversals serve as both a warning and an opportunity to a trader who can spot the staging ground of such a move to occur. By far one of the best ways to spot potential reversals in the market is to use the Chicago Board Options Exchange Volatility Index (VIX). The VIX reveals the market's expectation of 30-day volatility and is constructed using the implied volatilities of a range of Standard & Poor's 500 index options. This volatility is meant to be forward-looking and is calculated from both calls and puts. The VIX is often referred to as the "investor fear gauge" and a barometer of market risk. As a measure of volatility, the VIX has a tendency to revert back to its mean when it reaches extreme price points, and it is at these levels where a short-term price reversal is likely to occur in the S&P 500. Using a 40-day simple moving average (SMA) over the VIX where you can determine when the price action moves too far away from the moving average, where it will then revert to its mean by trading back down to the moving average itself. See Figure 1. |

|
| FIGURE 2: S&P 500. The S&P 500 trades downward to extreme levels just before the VIX indicates a short-term price reversal back to the upside on May 7, 2010, and May 21, 2010. |
| Graphic provided by: www.freestockcharts.com. |
| |
| This indicator works so well because it is built on the paradoxical principle that crowds are often wrong, particularly in trading. Traders get swept up at extreme levels of fear and greed, while other traders follow along almost like lemmings until they all fall a cliff together. However, by using the VIX to time your entries and exits, you can avoid the violent whipsaws in price action and the string of losses that result from them. |
Billy Williams has been trading the markets for 27 years, specializing in momentum trading with stocks and options.
| Company: | StockOptionSystem.com |
| E-mail address: | stockoptionsystem.com@gmail.com |
Traders' Resource Links | |
| StockOptionSystem.com has not added any product or service information to TRADERS' RESOURCE. | |
Click here for more information about our publications!
Comments
Date: 09/15/10Rank: 5Comment:

Request Information From Our Sponsors
- StockCharts.com, Inc.
- Candle Patterns
- Candlestick Charting Explained
- Intermarket Technical Analysis
- John Murphy on Chart Analysis
- John Murphy's Chart Pattern Recognition
- John Murphy's Market Message
- MurphyExplainsMarketAnalysis-Intermarket Analysis
- MurphyExplainsMarketAnalysis-Visual Analysis
- StockCharts.com
- Technical Analysis of the Financial Markets
- The Visual Investor
- VectorVest, Inc.
- Executive Premier Workshop
- One-Day Options Course
- OptionsPro
- Retirement Income Workshop
- Sure-Fire Trading Systems (VectorVest, Inc.)
- Trading as a Business Workshop
- VectorVest 7 EOD
- VectorVest 7 RealTime/IntraDay
- VectorVest AutoTester
- VectorVest Educational Services
- VectorVest OnLine
- VectorVest Options Analyzer
- VectorVest ProGraphics v6.0
- VectorVest ProTrader 7
- VectorVest RealTime Derby Tool
- VectorVest Simulator
- VectorVest Variator
- VectorVest Watchdog
