HOT TOPICS LIST
- MACD
- Fibonacci
- RSI
- Gann
- ADXR
- Stochastics
- Volume
- Triangles
- Futures
- Cycles
- Volatility
- ZIGZAG
- MESA
- Retracement
- Aroon
INDICATORS LIST
LIST OF TOPICS
PRINT THIS ARTICLE
by Chaitali Mohile
Can the fresh bullish breakout of Bank of America Corp. breach the moving average resistance?
Position: Buy
Chaitali Mohile
Active trader in the Indian stock markets since 2003 and a full-time writer. Trading is largely based upon technical analysis.
PRINT THIS ARTICLE
TECHNICAL ANALYSIS
Will BAC Breakout Surge?
09/07/10 12:36:40 PMby Chaitali Mohile
Can the fresh bullish breakout of Bank of America Corp. breach the moving average resistance?
Position: Buy
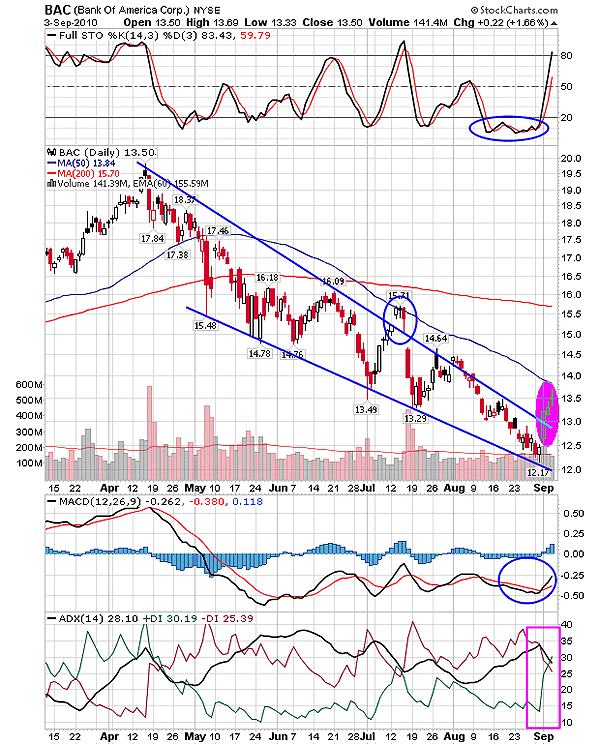
| In past few months, Bank of America Corp. (BAC) witnessed strong bearish currents. The stock flowed downward, forming a converging channel. The channel in Figure 1 is a falling wedge that breaks in an upward direction. BAC began its downward journey from the price level of $20 in April, initiating an intermediate downtrend. Due to the descending value, the selling pressure increased, the moving average convergence/divergence (MACD) (12,26,9) plunged in negative territory, and the stochastic (14,3,3) turned volatile near the 20 levels. Thus, all the indicators were bearish as the stock went down to $12. During the bearish rally, BAC challenged the upper trendline to undergo a bullish breakout. However, the 50-day moving average (MA) acted as a strong resistance and restricted the breakout in July 2010 (see Figure 1). |

|
| FIGURE 1: BAC, DAILY. The bullish breakout of the falling wedge has hit the 50-day MA resistance. The indicators would help BAC convert the MA resistance to the support and rally higher. |
| Graphic provided by: StockCharts.com. |
| |
| Later, the stock continued to move within the narrow range with high volatility in the volume. The two trendlines of the falling wedge have converged and were ready to undergo the bullish breakout. Accordingly, BAC violated the upper trendline resistance, initiating a fresh robust bullish rally in Figure 1. But will the stock succeed in breaching the 50-day MA resistance this time? |
| The answer would be yes. One of the reasons is the matured falling wedge formation ready for breakout. Second, the stochastic oscillator has surged sharply from the oversold region, the MACD (12,26,9) is showing a bullish crossover in negative territory, and the average directional movement index (ADX) (14) is likely to develop a fresh uptrend. Therefore, the conditions are more convincing to support the bullish rally above the 50-day MA. BAC has to sustain above the 50-day MA for the stable and confirmed rally. The 200-day MA resistance at 15 levels would be the target for BAC. |

|
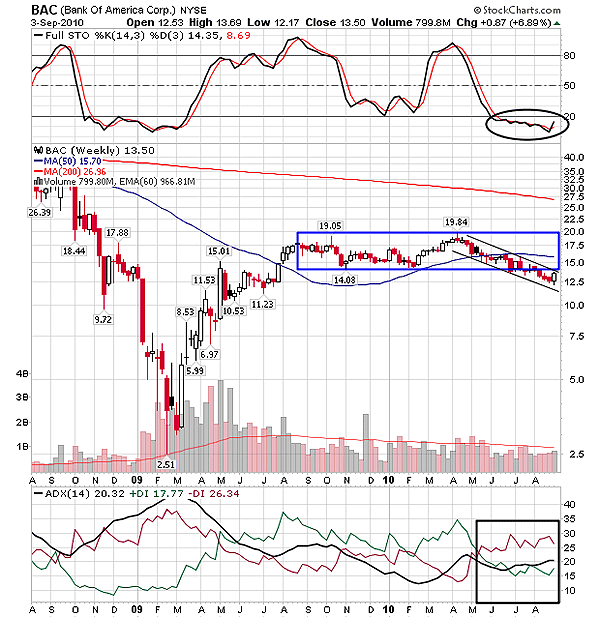
| FIGURE 2: BAC, WEEKLY. An oversold stochastic oscillator is ready to surge above the 20 levels. |
| Graphic provided by: StockCharts.com. |
| |
| BAC was consolidating in a very narrow range for more than a year. The falling wedge that is formed on the weekly time frame in Figure 2 breached the lower trading range at approximately 14 levels. The pattern has appeared on both the time frames of BAC, thus making the formation as well as the breakout more reliable. The pattern in Figure 2 is also ready to break upward. The 50-day MA shows resistance at 15.70 levels, and therefore, the potential target of BAC remains the same for short-term and long-term traders. |
| Thus, it is likely that BAC would hit the target of $15 in near term. However, the upper consolidation range at $20 remains the long-term resistance for the stock. |
Active trader in the Indian stock markets since 2003 and a full-time writer. Trading is largely based upon technical analysis.
| Company: | Independent |
| Address: | C1/3 Parth Indraprasth Towers. Vastrapur |
| Ahmedabad, Guj 380015 | |
| E-mail address: | chaitalimohile@yahoo.co.in |
Traders' Resource Links | |
| Independent has not added any product or service information to TRADERS' RESOURCE. | |
Click here for more information about our publications!
PRINT THIS ARTICLE

Request Information From Our Sponsors
- StockCharts.com, Inc.
- Candle Patterns
- Candlestick Charting Explained
- Intermarket Technical Analysis
- John Murphy on Chart Analysis
- John Murphy's Chart Pattern Recognition
- John Murphy's Market Message
- MurphyExplainsMarketAnalysis-Intermarket Analysis
- MurphyExplainsMarketAnalysis-Visual Analysis
- StockCharts.com
- Technical Analysis of the Financial Markets
- The Visual Investor
- VectorVest, Inc.
- Executive Premier Workshop
- One-Day Options Course
- OptionsPro
- Retirement Income Workshop
- Sure-Fire Trading Systems (VectorVest, Inc.)
- Trading as a Business Workshop
- VectorVest 7 EOD
- VectorVest 7 RealTime/IntraDay
- VectorVest AutoTester
- VectorVest Educational Services
- VectorVest OnLine
- VectorVest Options Analyzer
- VectorVest ProGraphics v6.0
- VectorVest ProTrader 7
- VectorVest RealTime Derby Tool
- VectorVest Simulator
- VectorVest Variator
- VectorVest Watchdog
