

HOT TOPICS LIST
- MACD
- Fibonacci
- RSI
- Gann
- ADXR
- Stochastics
- Volume
- Triangles
- Futures
- Cycles
- Volatility
- ZIGZAG
- MESA
- Retracement
- Aroon
INDICATORS LIST
LIST OF TOPICS
PRINT THIS ARTICLE
by Koos van der Merwe
The Dow Jones Transportation Average leads all other indexes.
Position: Accumulate
Koos van der Merwe
Has been a technical analyst since 1969, and has worked as a futures and options trader with First Financial Futures in Johannesburg, South Africa.
PRINT THIS ARTICLE
HEAD & SHOULDERS
Classic Dow Theory In Transports
09/07/10 09:27:28 AMby Koos van der Merwe
The Dow Jones Transportation Average leads all other indexes.
Position: Accumulate
| Charles Henry Dow was the founder and first editor of The Wall Street Journal. He was also the cofounder of Dow Jones and Co. In 1884, on July 3, he released the first Dow Jones average using 11 companies to compile the average. The stock averages were an index of industrial (manufacturing) companies and rail companies, but he soon dropped all nonrailroad companies from the average, forming a separate average for industrial companies, which he called the Dow Jones Industrial Average (DJIA). However, he knew that factories had to ship their goods to market, usually by rail. He concluded that a bull market in industrials could not occur unless the railway average rallied as well, usually before industrial companies. He believed that if manufacturers' profits were rising, it meant that they were producing more. If they produced more, then they had to ship more goods to consumers. Hence, if an investor was looking for signs of health in manufacturers, he or she had to look at the performance of the companies that shipped the output to market, namely by the railroads. The two averages should be moving in the same direction. When the performance of the averages diverge, it is a warning that change is in the air. Figure 1 is a chart of the Dow Jones transportation index, and the chart is suggesting that an inverted head & shoulders pattern is forming. |
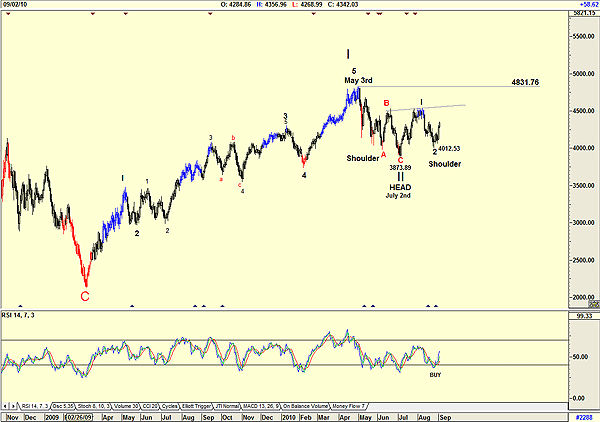
|
| FIGURE 1: DJTA |
| Graphic provided by: AdvancedGET. |
| |
| The DJTA reached a high of 4831.76 on May 3, 2010, and then fell to 3873.89 by July 2. It then retraced upward to 4516.67 and promptly fell to 4012.53. The positive moves of the past few days is starting to suggest that a shoulder is developing, and with the shoulder at A and a head at C, the pattern is starting to look very much like an inverted head & shoulders. To confirm this pattern, the index must break above the neckline. When it does so, it will suggest a target of 5167.87 as shown is Figure 2. The relative strength index (RSI) is suggesting a buy signal, confirming a move up. |
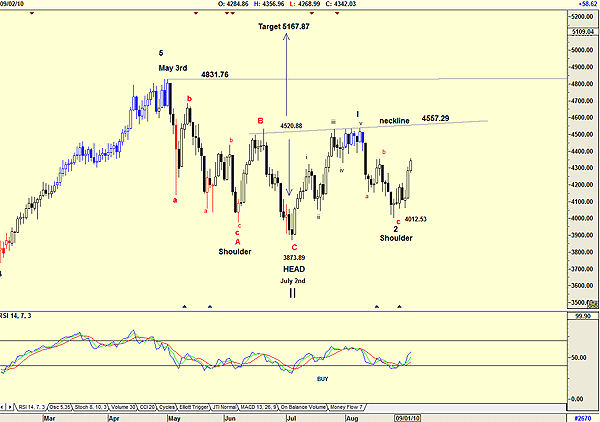
|
| FIGURE 2: DJTA. The DJTA is showing details of the inverted head & shoulders pattern. |
| Graphic provided by: AdvancedGET. |
| |
| Figure 2 is a more detailed chart showing my Elliott wave count and the suggested target of the inverted head & shoulders pattern. Should the index break above 4557.29, then test and break above the high of May 3 at 4831.76, then my wave count will indeed be true, suggesting that the index is in a wave III of a new bull market. The fact that the DJTA is tracing a pattern very similar to the Standard & Poor's 500 (see my previous article of Tuesday, August 31) is very comforting. Charles Dow believed that the DJTA should lead the Dow Jones index. I have, however, compared the DJTA to the S&P 500 and it definitely appears to be suggesting a new major bull market. |
Has been a technical analyst since 1969, and has worked as a futures and options trader with First Financial Futures in Johannesburg, South Africa.
| Address: | 3256 West 24th Ave |
| Vancouver, BC | |
| Phone # for sales: | 6042634214 |
| E-mail address: | petroosp@gmail.com |
Click here for more information about our publications!
Comments

Request Information From Our Sponsors
- VectorVest, Inc.
- Executive Premier Workshop
- One-Day Options Course
- OptionsPro
- Retirement Income Workshop
- Sure-Fire Trading Systems (VectorVest, Inc.)
- Trading as a Business Workshop
- VectorVest 7 EOD
- VectorVest 7 RealTime/IntraDay
- VectorVest AutoTester
- VectorVest Educational Services
- VectorVest OnLine
- VectorVest Options Analyzer
- VectorVest ProGraphics v6.0
- VectorVest ProTrader 7
- VectorVest RealTime Derby Tool
- VectorVest Simulator
- VectorVest Variator
- VectorVest Watchdog
- StockCharts.com, Inc.
- Candle Patterns
- Candlestick Charting Explained
- Intermarket Technical Analysis
- John Murphy on Chart Analysis
- John Murphy's Chart Pattern Recognition
- John Murphy's Market Message
- MurphyExplainsMarketAnalysis-Intermarket Analysis
- MurphyExplainsMarketAnalysis-Visual Analysis
- StockCharts.com
- Technical Analysis of the Financial Markets
- The Visual Investor