HOT TOPICS LIST
- MACD
- Fibonacci
- RSI
- Gann
- ADXR
- Stochastics
- Volume
- Triangles
- Futures
- Cycles
- Volatility
- ZIGZAG
- MESA
- Retracement
- Aroon
INDICATORS LIST
LIST OF TOPICS
PRINT THIS ARTICLE
by Donald W. Pendergast, Jr.
Some rallies are fakers, while others become real moneymakers. With a full 20% of the S&P 500 component stocks flashing daily RMO swing buy signals on September 1, 2010, this rally might end up in the moneymaker category.
Position: Buy
Donald W. Pendergast, Jr.
Donald W. Pendergast is a financial markets consultant who offers specialized services to stock brokers and high net worth individuals who seek a better bottom line for their portfolios.
PRINT THIS ARTICLE
TRADING SYSTEMS
Twenty Percent Of SP 500 Components Trigger A Buy Signal
09/02/10 08:19:51 AMby Donald W. Pendergast, Jr.
Some rallies are fakers, while others become real moneymakers. With a full 20% of the S&P 500 component stocks flashing daily RMO swing buy signals on September 1, 2010, this rally might end up in the moneymaker category.
Position: Buy
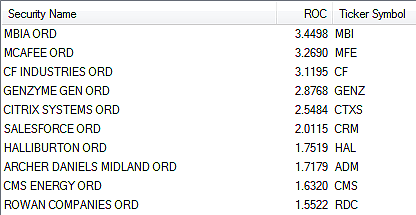
| The bullish reversal move in the major US stock indexes on Wednesday, September 1, 2010, was a real beauty, as it was the largest-range daily bull move since July 7, 2010, a reversal move that launched and/or confirmed the start of a powerful four-week rally. Will this reversal also allow the big index to tack on an additional 100 points, just like we saw a couple of months ago? No one knows, but moves like this shouldn't be taken lightly. Let's look at a list of the 10 strongest Standard & Poor's 500 component stocks that are giving new Rahul Mohindar oscillator (RMO) swing buy signals and see just how broad-based this potentially explosive rally really is (Figure 1). |

|
| FIGURE 1: TOP 10 RMO BUYS. When you're looking to latch onto a strong reversal in the S&P 500, always check to see if the rally is broad-based. The top 10 RMO buys listed here hail from a very diverse number of industry groups. |
| Graphic provided by: MetaStock. |
| Graphic provided by: MetaStock Explorer. |
| |
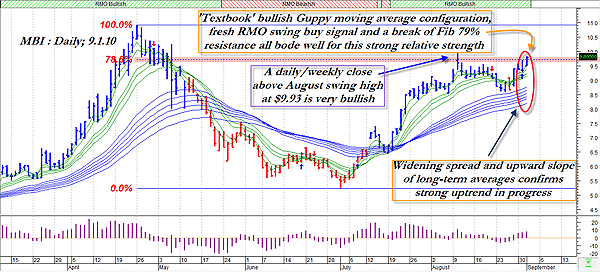
| Here are the top 10 stocks out of the 98 giving us RMO swing buy signals. If you look at the list, you can see that the banking, computer software/security, chemicals, biotech, business services, energy services, and agricultural industry groups are all represented, meaning that this rally is indeed being powered by a diverse group of stocks that hail from many vital groups and sectors. If you're a short- to medium-term bull, this can only be good news. The S&P 500's seasonal tendency for the month of September since 1982 has been generally neutral to slightly bearish, but if the index can put on a strong performance (or at least regain some more of the major losses since April of this year) for the next two months, it will be in fine shape to take full advantage of the highly reliable bullish seasonal tendency to rally strongly from late October through late December. Figure 2 is a look at one of the nicer-looking chart setups for one of the stocks shown in the relative strength ranking graphic, MBI. |

|
| FIGURE 2: MBI, DAILY. A textbook quality pattern? Seems likely; a daily/weekly close above the August swing high of $9.93 could spark even more buying, getting this emerging trend rolling in style. |
| Graphic provided by: MetaStock. |
| Graphic provided by: Rahul Mohindar/Walter Bressert indicators for Meta. |
| |
| This is one of those textbook-quality technical setups that writers love to find. This thing has a lot going for it: * A perfect bullish Guppy moving average configuration * A fresh RMO swing buy signal coming after a test of major support * MBI has the best relative strength vs. the S&P 500 over the last 13 weeks (based on a 13-week rate of change calculation) * The stock has just punched through a major Fibonacci resistance barrier -- the 79% mark of the April-June decline -- and is now in position to also challenge the August swing high at $9.93. How can we play this? Two ways come to mind: One is to put on a covered-call play; as of September 1, 2010, you could buy an October $10 strike covered call in MBI for only $9.04, and with the stock currently at $9.80, that translates into an annualized return of about 62% if the stock is called away at October expiry. Not a bad profit if it works out as anticipated. You might want to set an initial stop-loss on the position near $9.00 and then let it gradually rise if the stock can make a solid close above $10 on continued strong momentum. With a covered call, you want to give the position more room for error than on a straight stock position, especially since the short call gives you extra staying power by virtue of its daily time decay factor. For stock-only traders, why not place a buy-stop near $9.95, hoping to capitalize on a major continuation of the current uptrend. There are sure to be a zillion buy orders between $9.94 and $10.00 on this stock, so you may have a lot of help propelling this financial issue to even higher price levels in the days ahead. An initial sell-stop near $9.20 should help keep things from getting out of hand if MBI suddenly decides to reverse lower. Follow up the move higher with a three-bar trail of the daily lows and be sure to take at least some profit if you see the April high of $10.92 getting too close for comfort, as that should be a very powerful resistance area. RMO swing buy signals seem to work very well in conjunction with the Guppy moving averages in MetaStock, so give them a try on the markets you follow. |
Donald W. Pendergast is a financial markets consultant who offers specialized services to stock brokers and high net worth individuals who seek a better bottom line for their portfolios.
| Title: | Writer, market consultant |
| Company: | Linear Trading Systems LLC |
| Jacksonville, FL 32217 | |
| Phone # for sales: | 904-239-9564 |
| E-mail address: | lineartradingsys@gmail.com |
Traders' Resource Links | |
| Linear Trading Systems LLC has not added any product or service information to TRADERS' RESOURCE. | |
Click here for more information about our publications!
Comments

Request Information From Our Sponsors
- StockCharts.com, Inc.
- Candle Patterns
- Candlestick Charting Explained
- Intermarket Technical Analysis
- John Murphy on Chart Analysis
- John Murphy's Chart Pattern Recognition
- John Murphy's Market Message
- MurphyExplainsMarketAnalysis-Intermarket Analysis
- MurphyExplainsMarketAnalysis-Visual Analysis
- StockCharts.com
- Technical Analysis of the Financial Markets
- The Visual Investor
- VectorVest, Inc.
- Executive Premier Workshop
- One-Day Options Course
- OptionsPro
- Retirement Income Workshop
- Sure-Fire Trading Systems (VectorVest, Inc.)
- Trading as a Business Workshop
- VectorVest 7 EOD
- VectorVest 7 RealTime/IntraDay
- VectorVest AutoTester
- VectorVest Educational Services
- VectorVest OnLine
- VectorVest Options Analyzer
- VectorVest ProGraphics v6.0
- VectorVest ProTrader 7
- VectorVest RealTime Derby Tool
- VectorVest Simulator
- VectorVest Variator
- VectorVest Watchdog
