

HOT TOPICS LIST
- MACD
- Fibonacci
- RSI
- Gann
- ADXR
- Stochastics
- Volume
- Triangles
- Futures
- Cycles
- Volatility
- ZIGZAG
- MESA
- Retracement
- Aroon
INDICATORS LIST
LIST OF TOPICS
PRINT THIS ARTICLE
by Koos van der Merwe
The market may be in a sideways trend until after the US Labor Day and the Canadian Labour Day. The problem, however, is that the month of September is notorious for being the quietest of the year, presenting remarkable buying opportunities. So what are you waiting for? Go for it!
Position: Accumulate
Koos van der Merwe
Has been a technical analyst since 1969, and has worked as a futures and options trader with First Financial Futures in Johannesburg, South Africa.
PRINT THIS ARTICLE
ELLIOTT WAVE
Time To Buy?
08/31/10 08:33:13 AMby Koos van der Merwe
The market may be in a sideways trend until after the US Labor Day and the Canadian Labour Day. The problem, however, is that the month of September is notorious for being the quietest of the year, presenting remarkable buying opportunities. So what are you waiting for? Go for it!
Position: Accumulate
| I have looked at my charts, studied them, and redrawn and restudied them. I have looked at the fundamentals and looked at the political scene in the United States, and with the midterm elections due in November, the Democratic Party is blaming the previous Bush administration for the deep hole the economy is in, while the Republicans are blaming the Obama administration for not doing enough to get the economy out of that hole. Investors are spooked, believing that the next two years will be about debt and deficit. How much of this is genuine and how much is pure fog does not matter. Investors are staying away from the market and buying bonds, even though they pay only 3%-odd interest, to the extent where there is now talk of a bond bubble. So fear rules the market. My charts, on the other hand, and I have studied and redrawn them over and over again looking for an alternative wave count, is still positive, as shown in Figure 1. No matter how hard I try to find a negative wave count, and I do study the wave counts of all those analysts who put their negativity out there, I simply cannot agree with them. So, ladies and gentlemen, Democrats and Republicans (I am Canadian, so I have no bias there) and especially those bears who growl so fiercely, I am still a bull. I still believe that the stock market and economy of the US is in a slow but steady recovery. |
|
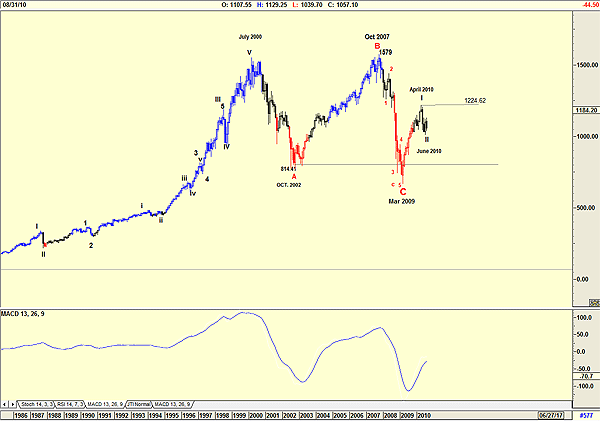
| FIGURE 1: S&P 500, MONTHLY |
| Graphic provided by: AdvancedGET. |
| |
| Figure 1 is a monthly chart of the Standard & Poor's 500 and still suggests that the index has completed a Wave I and Wave II of a new bull market. This will be confirmed once the index breaks above 1224.62 as shown on the monthly chart. The moving average convergence/divergence (MACD) is still positive, so when I hear fundamental analysts state on CNBC that the trend is negative, I shake my head and ask, "What am I not seeing?" |
|
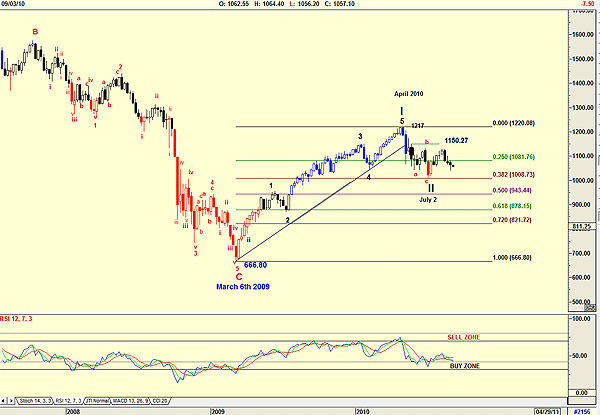
| FIGURE 2: S&P 500, WEEKLY |
| Graphic provided by: AdvancedGET. |
| |
| Figure 2 is a weekly chart and confirms my monthly count for the following reasons: 1. The C-wave as shown bottomed on March 6, 2009, at 666.80. 2. Wave I moved up in a perfect five-wave count to a high of 1220.08 by April 2010. 3. Wave II moved down in an abc pattern to a low of 1008.73 by July 2. This level is also a 38.2% retracement of the rise of Wave I. Combined with a relative strength index (RSI) that has given a buy signal, this looks very real. |
|
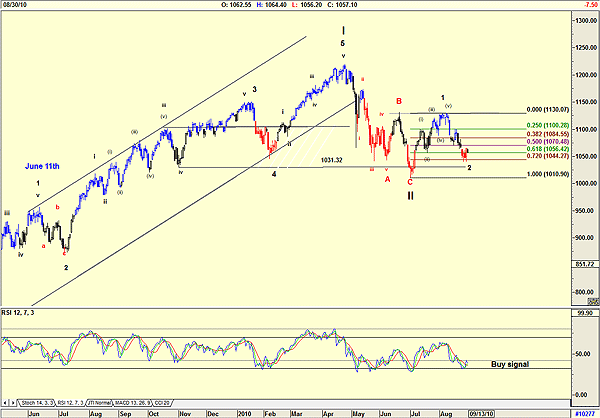
| FIGURE 3: S&P 500, DAILY |
| Graphic provided by: AdvancedGET. |
| |
| Finally, Figure 3 is a daily chart and shows the following: a. Wave II bottomed at 1031.82 (slightly below but within limits). b. The index then rose to test the top of Wave B at 1130.07 and found a strong resistance level, completing Wave 1 of Wave III. The rise was in a five-wave flat,where wave (iii) was less that wave (i) and wave (v) was therefore less than wave (iii). c. At present, the index is in a Wave 2 of Wave III and does appear to have found support at 1044.27, a 72% retracement of the rise of Wave 1. d. The RSI has given a buy signal, suggesting that the market should start rising. |
| My charts are still telling me that the market is forming a major start to a new bull market, in the form of a Wave III. With the market rising from 666.80 to 1220.08 as shown in Figure 2, we can therefore expect Wave II to be not less than 1773.36 (1220.08 - 666.80 = 553.28 + 1220.08 = 1773.36). The uncertainty is as usually happens at market bottoms: Is this truly the bottom of Wave 2 of Wave III? I believe that it is and my chart counts support my belief. |
Has been a technical analyst since 1969, and has worked as a futures and options trader with First Financial Futures in Johannesburg, South Africa.
| Address: | 3256 West 24th Ave |
| Vancouver, BC | |
| Phone # for sales: | 6042634214 |
| E-mail address: | petroosp@gmail.com |
Click here for more information about our publications!
PRINT THIS ARTICLE

Request Information From Our Sponsors
- VectorVest, Inc.
- Executive Premier Workshop
- One-Day Options Course
- OptionsPro
- Retirement Income Workshop
- Sure-Fire Trading Systems (VectorVest, Inc.)
- Trading as a Business Workshop
- VectorVest 7 EOD
- VectorVest 7 RealTime/IntraDay
- VectorVest AutoTester
- VectorVest Educational Services
- VectorVest OnLine
- VectorVest Options Analyzer
- VectorVest ProGraphics v6.0
- VectorVest ProTrader 7
- VectorVest RealTime Derby Tool
- VectorVest Simulator
- VectorVest Variator
- VectorVest Watchdog
- StockCharts.com, Inc.
- Candle Patterns
- Candlestick Charting Explained
- Intermarket Technical Analysis
- John Murphy on Chart Analysis
- John Murphy's Chart Pattern Recognition
- John Murphy's Market Message
- MurphyExplainsMarketAnalysis-Intermarket Analysis
- MurphyExplainsMarketAnalysis-Visual Analysis
- StockCharts.com
- Technical Analysis of the Financial Markets
- The Visual Investor