HOT TOPICS LIST
- MACD
- Fibonacci
- RSI
- Gann
- ADXR
- Stochastics
- Volume
- Triangles
- Futures
- Cycles
- Volatility
- ZIGZAG
- MESA
- Retracement
- Aroon
INDICATORS LIST
LIST OF TOPICS
PRINT THIS ARTICLE
by Chaitali Mohile
Loral Space & Communication has been traveling in bullish atmosphere. A likely breakout could give it a boost.
Position: Buy
Chaitali Mohile
Active trader in the Indian stock markets since 2003 and a full-time writer. Trading is largely based upon technical analysis.
PRINT THIS ARTICLE
BREAKOUTS
LORL Eager To Break Out
08/26/10 12:35:40 PMby Chaitali Mohile
Loral Space & Communication has been traveling in bullish atmosphere. A likely breakout could give it a boost.
Position: Buy
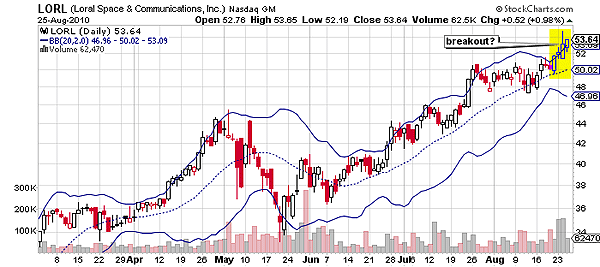
| Loral Space & Communication (LORL) has been respecting the upper and lower ends of the Bollinger band (20,2,0). The indicator is one of the best tracking systems for breakouts as well as for regular trading. A system trade can be followed between the upper and lower bands of the indicator. According to Figure 1, LORL has been moving above the center line for a longer time, indicating consistent bullish strength throughout the period. The stock continued to travel along with the upper band. However, the band resistance was never breached. After hitting the upper band, the stock has retraced back towards the center line. |

|
| FIGURE 1: LORL, DAILY |
| Graphic provided by: StockCharts.com. |
| |
| Recently, LORL witnessed robust bullish trading sessions that have challenged the strength of the upper band. The last four bullish candles in Figure 1 are showing willingness to break the Bollinger band. All the four white candles have made the new highs and have closed above the upper band. This shows that there could be some significant force in the rally, which would possibly result in a bullish breakout. |

|
| FIGURE 2: LORL, DAILY |
| Graphic provided by: StockCharts.com. |
| |
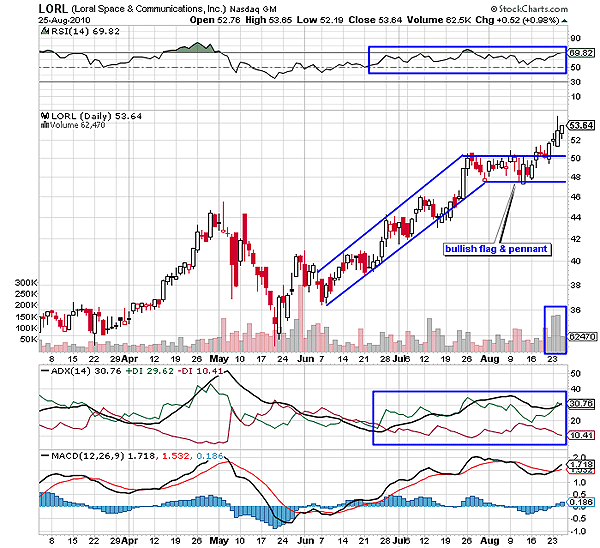
| Figure 2 also shows a daily chart with the indicators and the price chart to understand the potential and stability of the breakout. The price chart shows a bullish breakout of a flag & pennant -- a continuous formation of LORL. Increased volume confirms the stability of the breakout. The average directional index (ADX) (14) shows a developed uptrend, and the relative strength index (RSI) (14) is indicating a bullish force in the breakout rally. The positive moving average convergence/divergence (MACD) (12,26,9) signifies positive momentum. Therefore, LORL has already broken the flag & pennant formation and is ready to surge above the upper Bollinger band resistance. |

|
| FIGURE 3: LORL, WEEKLY |
| Graphic provided by: StockCharts.com. |
| |
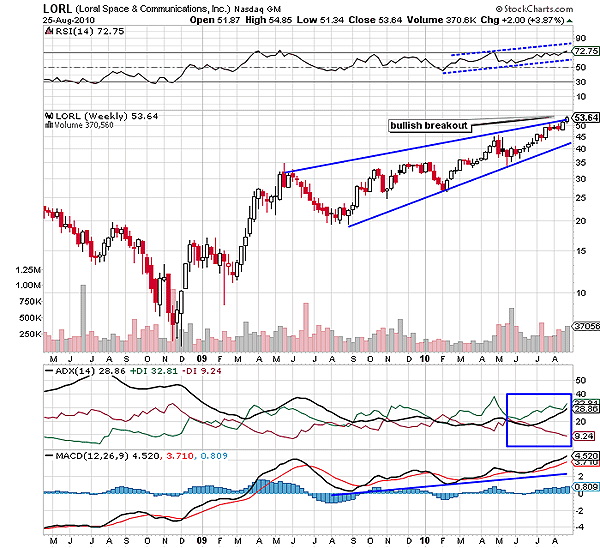
| On the weekly time frame, the stock has formed a long-term rising wedge formation, a bearish reversal pattern. But it seems that the pattern is likely to undergo a bullish breakout against the pattern's technical direction -- a bearish breakout. The RSI (14) is climbing an overbought region with no reluctance. The MACD (12,26,9) is ascending with the support of the zero line in positive territory, and the uptrend in Figure 3 is developing. Therefore, the bullish indicators would help the upward breakout of the rising wedge. The breakout would highlight a major pattern failure and initiate the new upward move. After the breakout, LORL should establish support at the upper trendline. |
| Thus, LORL should be ready to blast off further into bullish atmosphere very soon. |
Active trader in the Indian stock markets since 2003 and a full-time writer. Trading is largely based upon technical analysis.
| Company: | Independent |
| Address: | C1/3 Parth Indraprasth Towers. Vastrapur |
| Ahmedabad, Guj 380015 | |
| E-mail address: | chaitalimohile@yahoo.co.in |
Traders' Resource Links | |
| Independent has not added any product or service information to TRADERS' RESOURCE. | |
Click here for more information about our publications!
PRINT THIS ARTICLE

Request Information From Our Sponsors
- StockCharts.com, Inc.
- Candle Patterns
- Candlestick Charting Explained
- Intermarket Technical Analysis
- John Murphy on Chart Analysis
- John Murphy's Chart Pattern Recognition
- John Murphy's Market Message
- MurphyExplainsMarketAnalysis-Intermarket Analysis
- MurphyExplainsMarketAnalysis-Visual Analysis
- StockCharts.com
- Technical Analysis of the Financial Markets
- The Visual Investor
- VectorVest, Inc.
- Executive Premier Workshop
- One-Day Options Course
- OptionsPro
- Retirement Income Workshop
- Sure-Fire Trading Systems (VectorVest, Inc.)
- Trading as a Business Workshop
- VectorVest 7 EOD
- VectorVest 7 RealTime/IntraDay
- VectorVest AutoTester
- VectorVest Educational Services
- VectorVest OnLine
- VectorVest Options Analyzer
- VectorVest ProGraphics v6.0
- VectorVest ProTrader 7
- VectorVest RealTime Derby Tool
- VectorVest Simulator
- VectorVest Variator
- VectorVest Watchdog
