HOT TOPICS LIST
- MACD
- Fibonacci
- RSI
- Gann
- ADXR
- Stochastics
- Volume
- Triangles
- Futures
- Cycles
- Volatility
- ZIGZAG
- MESA
- Retracement
- Aroon
INDICATORS LIST
LIST OF TOPICS
PRINT THIS ARTICLE
by Chaitali Mohile
The lower lows and lower highs have dragged the bullish rally under pressure.
Position: N/A
Chaitali Mohile
Active trader in the Indian stock markets since 2003 and a full-time writer. Trading is largely based upon technical analysis.
PRINT THIS ARTICLE
CHART ANALYSIS
Austria iShares Rally Suspended
08/25/10 09:40:42 AMby Chaitali Mohile
The lower lows and lower highs have dragged the bullish rally under pressure.
Position: N/A
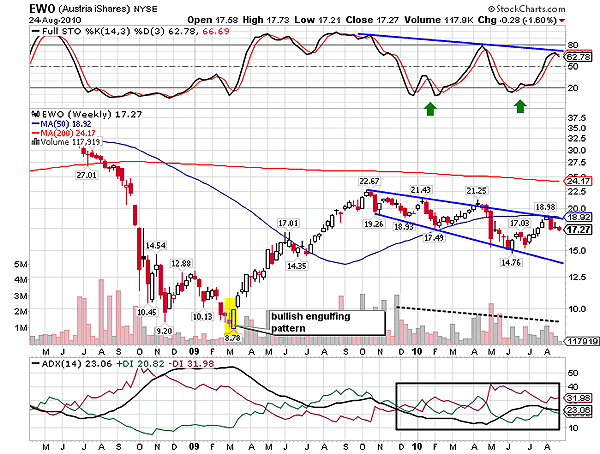
| Austria iShares (EWO) had a fresh start with a bullish engulfing candlestick pattern in March 2009. The rally gained a profit of $14 in eight to nine months. However, the 200-day moving average (MA) resistance remained untouched. EWO changed its direction from $22.14 levels and tried to move parallel to the 200-day MA, but the first two lower lows and highs formed a divergence between the price movement and the resistance line. The consolidation range continued to form a series of lower lows and lower highs. The trendline in Figure 1 shows a descending channel, indicating the possibility of a wide trading range for EWO. But EWO has been ranging for more than six months now, so the previous advance rally is technically terminated. |

|
| FIGURE 1: EWO, WEEKLY. The index is moving in the broadening descending channel. |
| Graphic provided by: StockCharts.com. |
| |
| Volume has descended along with the value of the stock. The full stochastic (14,3,3) is descending as well. The lower highs of the oscillator are indicating decelerating momentum for EWO and is likely to hit an oversold level at $20. Earlier, the indicator had surged from $20 levels, initiating a fresh bullish rally within the broadening channel. The weak average directional index (ADX) (14) in Figure 1 has moved above $20 levels, developing a fresh downtrend for EWO. The previous advance rally could not develop a robust uptrend, and as a result, the rally turned sideways. Currently, the downtrend shown in Figure 1 signifies the rally would continue to descend within the channel. Since the trading range is widening, traders can set their positions from the lower trendline to the upper and vice versa. However, a channel breakout in either direction is possible. |

|
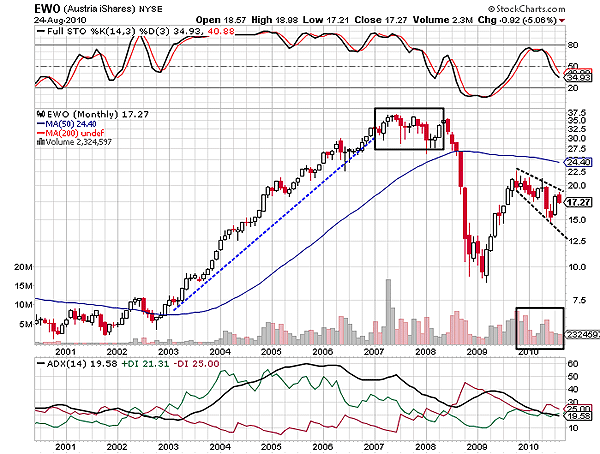
| FIGURE 2: EWO, MONTHLY. The descending channel shows the range of $12.5 and $17. |
| Graphic provided by: StockCharts.com. |
| |
| EWO was in a robust uptrend from 2003 to 2007. This overheated bullish trend was followed by a long-term consolidation. The lower range of consolidation was violated in early 2008 and a fresh reversal rally was born, with the new bearish move whipping out all the earlier gains. The relief rally from $8 could not regain the previous loss. The price action that was initiated in 2009 barely recovered 50% of the bearish rally and turned sideways. The black dotted line in Figure 2 shows the descending consolidation range. According to the monthly time frame, the trading range is between $12 and $17.50, which can be carefully traded. The stochastic (14,3,3) and the developing downtrend of the ADX (14) does not suggest any bullish breakout. |
| As a result, the advance rally of EWO has been suspended. The index could continue its journey within the broadening channel. |
Active trader in the Indian stock markets since 2003 and a full-time writer. Trading is largely based upon technical analysis.
| Company: | Independent |
| Address: | C1/3 Parth Indraprasth Towers. Vastrapur |
| Ahmedabad, Guj 380015 | |
| E-mail address: | chaitalimohile@yahoo.co.in |
Traders' Resource Links | |
| Independent has not added any product or service information to TRADERS' RESOURCE. | |
Click here for more information about our publications!
Comments

Request Information From Our Sponsors
- StockCharts.com, Inc.
- Candle Patterns
- Candlestick Charting Explained
- Intermarket Technical Analysis
- John Murphy on Chart Analysis
- John Murphy's Chart Pattern Recognition
- John Murphy's Market Message
- MurphyExplainsMarketAnalysis-Intermarket Analysis
- MurphyExplainsMarketAnalysis-Visual Analysis
- StockCharts.com
- Technical Analysis of the Financial Markets
- The Visual Investor
- VectorVest, Inc.
- Executive Premier Workshop
- One-Day Options Course
- OptionsPro
- Retirement Income Workshop
- Sure-Fire Trading Systems (VectorVest, Inc.)
- Trading as a Business Workshop
- VectorVest 7 EOD
- VectorVest 7 RealTime/IntraDay
- VectorVest AutoTester
- VectorVest Educational Services
- VectorVest OnLine
- VectorVest Options Analyzer
- VectorVest ProGraphics v6.0
- VectorVest ProTrader 7
- VectorVest RealTime Derby Tool
- VectorVest Simulator
- VectorVest Variator
- VectorVest Watchdog
