HOT TOPICS LIST
- MACD
- Fibonacci
- RSI
- Gann
- ADXR
- Stochastics
- Volume
- Triangles
- Futures
- Cycles
- Volatility
- ZIGZAG
- MESA
- Retracement
- Aroon
INDICATORS LIST
LIST OF TOPICS
PRINT THIS ARTICLE
by Koos van der Merwe
What's going on with the nation's largest traditional bookseller, which reported fiscal first-quarter results today?
Position: Hold
Koos van der Merwe
Has been a technical analyst since 1969, and has worked as a futures and options trader with First Financial Futures in Johannesburg, South Africa.
PRINT THIS ARTICLE
BULL/BEAR MARKET
What Is It With Barnes & Noble?
08/24/10 08:40:37 AMby Koos van der Merwe
What's going on with the nation's largest traditional bookseller, which reported fiscal first-quarter results today?
Position: Hold
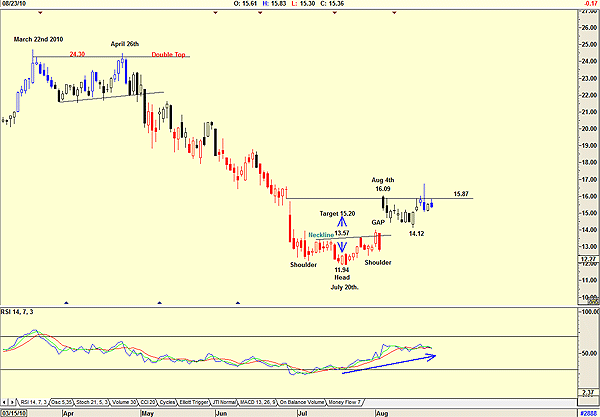
| Barnes & Noble has been very much in the headlines recently, and the share price from March 2010 has fallen dramatically from a high of $24.30 on March 22 to a low of $11.94 by July 20. There is no doubt that Apple's iPad is to blame for the fall, plus Amazon's cutting the price of its Kindle ebook reader to compete. Investors will also be looking for how well Barnes & Noble's own entry into the electronic book reader market, the Nook, is selling, and how revenue from the company's ebookstore is doing. The Nook ereader and its connected ebook markets are growing fast, adding to the competition that traditional booksellers face from online retailers and discounters. Bookstores are increasingly looking toward the ebook market as their best bet for increasing revenue. Is the chart of the share price forecasting a positive or negative reaction? |

|
| FIGURE 1: BARNES & NOBLE, DAILY |
| Graphic provided by: AdvancedGET. |
| |
| Figure 1 shows how the price fell from $24.30 after forming a classic double-top formation. The price fell to $11.94 by July 20 and then it formed an inverse head & shoulders pattern, suggesting a target of $15.20. The price actually rose on a gap to $16.09 on August 4, as shown on the chart, before meeting resistance at $15.87 as the upper limit of a previous minor gap. From $16.09 on August 4, the price fell to fill that gap, bottoming at $14.12 before rising to retest the $15.87 level. So what now? The relative strength index (RSI) is bullish, suggesting a positive result, but the strong resistance at $15.87 is asking questions. |

|
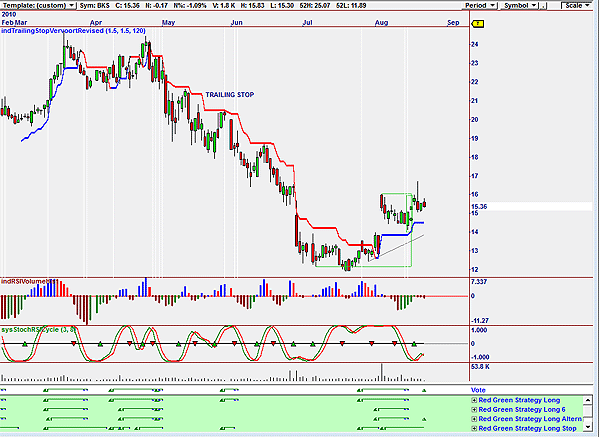
| FIGURE 2: BARNES & NOBLE, SHOWING BUY STRATEGY |
| Graphic provided by: OmniTrader. |
| |
| Figure 2 is an OmniTrader chart showing red/green strategies that give me an idea how to play the share. The vote line is suggesting a buy based on the strategy of a red green long alternative, giving a buy signal supported by the buy & hold signal given by the red green strategy long stop. Do note that both the RSI volume histogram and stochastic RSI cycle indicator shown are both suggesting that a buy signal is on the cards. Will Barnes & Noble find positive news both charts are calling for? We'll see. Of course, a positive DJIA and S&P 500 will help. |
Has been a technical analyst since 1969, and has worked as a futures and options trader with First Financial Futures in Johannesburg, South Africa.
| Address: | 3256 West 24th Ave |
| Vancouver, BC | |
| Phone # for sales: | 6042634214 |
| E-mail address: | petroosp@gmail.com |
Click here for more information about our publications!
PRINT THIS ARTICLE

Request Information From Our Sponsors
- StockCharts.com, Inc.
- Candle Patterns
- Candlestick Charting Explained
- Intermarket Technical Analysis
- John Murphy on Chart Analysis
- John Murphy's Chart Pattern Recognition
- John Murphy's Market Message
- MurphyExplainsMarketAnalysis-Intermarket Analysis
- MurphyExplainsMarketAnalysis-Visual Analysis
- StockCharts.com
- Technical Analysis of the Financial Markets
- The Visual Investor
- VectorVest, Inc.
- Executive Premier Workshop
- One-Day Options Course
- OptionsPro
- Retirement Income Workshop
- Sure-Fire Trading Systems (VectorVest, Inc.)
- Trading as a Business Workshop
- VectorVest 7 EOD
- VectorVest 7 RealTime/IntraDay
- VectorVest AutoTester
- VectorVest Educational Services
- VectorVest OnLine
- VectorVest Options Analyzer
- VectorVest ProGraphics v6.0
- VectorVest ProTrader 7
- VectorVest RealTime Derby Tool
- VectorVest Simulator
- VectorVest Variator
- VectorVest Watchdog
