HOT TOPICS LIST
- MACD
- Fibonacci
- RSI
- Gann
- ADXR
- Stochastics
- Volume
- Triangles
- Futures
- Cycles
- Volatility
- ZIGZAG
- MESA
- Retracement
- Aroon
INDICATORS LIST
LIST OF TOPICS
PRINT THIS ARTICLE
by Chaitali Mohile
Pactiv Corp. is in a steady uptrend. The breakout pattern of the stock is very different.
Position: N/A
Chaitali Mohile
Active trader in the Indian stock markets since 2003 and a full-time writer. Trading is largely based upon technical analysis.
PRINT THIS ARTICLE
GAPS
Pactiv Corp Has Different Trading Pattern
08/20/10 10:33:54 AMby Chaitali Mohile
Pactiv Corp. is in a steady uptrend. The breakout pattern of the stock is very different.
Position: N/A
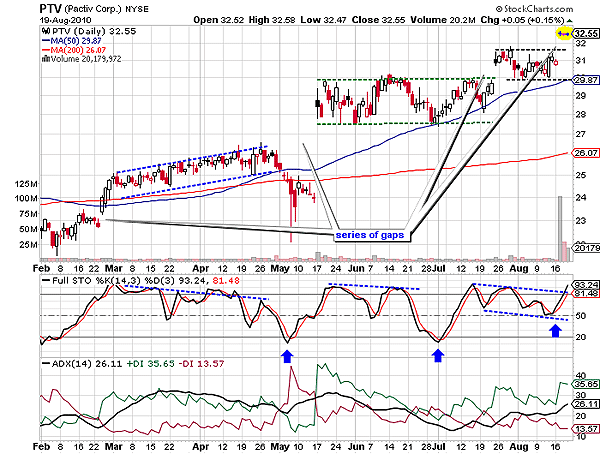
| Pactiv Corp. (PTV) is one of the major participants of the materials sector. The stock is heading towards new highs. After beginning a bullish rally in February 2010, PTV attempted a different breakout style. The stock jumped from the consolidation range while traveling north on the price chart. Since February, PTV formed a series of gap-up breakouts. There are four gaps on the daily chart in Figure 1. Initially, the breakout volume was discouraging, but the huge gapup in May generated bullish sentiments in the stock. The breakout breached the 200-day and the 50-day moving average (MA) resistance. |

|
| FIGURE 1: PTV, DAILY. The volumes during breakouts were high compared to the consolidation period. |
| Graphic provided by: StockCharts.com. |
| |
| PTV is the perfect example of gap-up trading. The stock entered a long consolidation range after the breakout. Although the gaps cannot be anticipated, they can be traded well if a proper trading system is followed. The sideways movement of PTV allows for a good entry point for long positions. As the stock is following one particular pattern, trading the future rally would be safe. In Figure 1, PTV ranged for a month in a healthy uptrend, and new positions can be triggered immediately after the gap-up with an appropriate stop-loss. You shouldn't make this trading decision in isolation; it has to be in accordance with the technical indicators. |
| Here, I have used my all-time favorite momentum indicators, the full stochastic and the trend indicator average directional index (ADX) (14). During consolidation, the stochastic oscillator (14,3,3) formed a lower high. Later, the gap-up pulled the oscillator with a lot of pressure. The stochastic surged with the support of the 20 (an oversold) level and with the bullish levels at 50. The ADX (14) suggested a developed uptrend. Thus, the indicators were bullish throughout the rally, strengthening long positions. |

|
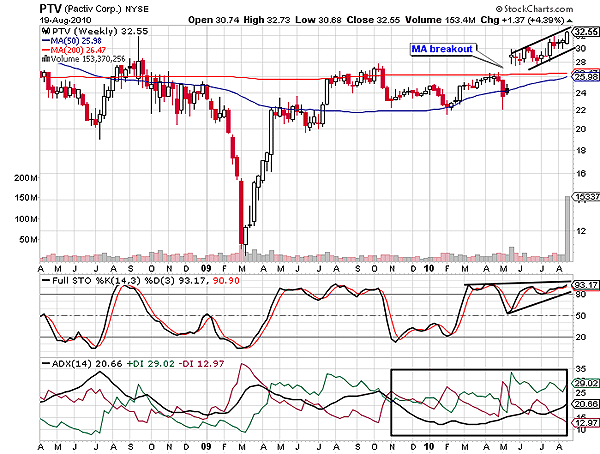
| FIGURE 2: PTV, WEEKLY. After the 200-day MA breakout, the stock formed the ascending channel. |
| Graphic provided by: StockCharts.com. |
| |
| Recently, PTV has once again surged with another gap-up (Figure 2). The price is consolidating in a very narrow range, but the stochastic has breached a descending channel in the bullish direction. The uptrend is developing. Thus, the fresh buy trade can be set. The long-term MA resistance was breached in March 2010, again with the gapup. Thereafter, PTV rushed into a perfect ascending channel with good volume. The momentum oscillator is rising in the overbought area and an uptrend is developing. Therefore, long-term traders can stay long till price ascends in the channel. |
| To conclude, PTV is a stock that can be considered for trading gap-up patterns. |
Active trader in the Indian stock markets since 2003 and a full-time writer. Trading is largely based upon technical analysis.
| Company: | Independent |
| Address: | C1/3 Parth Indraprasth Towers. Vastrapur |
| Ahmedabad, Guj 380015 | |
| E-mail address: | chaitalimohile@yahoo.co.in |
Traders' Resource Links | |
| Independent has not added any product or service information to TRADERS' RESOURCE. | |
Click here for more information about our publications!
PRINT THIS ARTICLE

Request Information From Our Sponsors
- StockCharts.com, Inc.
- Candle Patterns
- Candlestick Charting Explained
- Intermarket Technical Analysis
- John Murphy on Chart Analysis
- John Murphy's Chart Pattern Recognition
- John Murphy's Market Message
- MurphyExplainsMarketAnalysis-Intermarket Analysis
- MurphyExplainsMarketAnalysis-Visual Analysis
- StockCharts.com
- Technical Analysis of the Financial Markets
- The Visual Investor
- VectorVest, Inc.
- Executive Premier Workshop
- One-Day Options Course
- OptionsPro
- Retirement Income Workshop
- Sure-Fire Trading Systems (VectorVest, Inc.)
- Trading as a Business Workshop
- VectorVest 7 EOD
- VectorVest 7 RealTime/IntraDay
- VectorVest AutoTester
- VectorVest Educational Services
- VectorVest OnLine
- VectorVest Options Analyzer
- VectorVest ProGraphics v6.0
- VectorVest ProTrader 7
- VectorVest RealTime Derby Tool
- VectorVest Simulator
- VectorVest Variator
- VectorVest Watchdog
